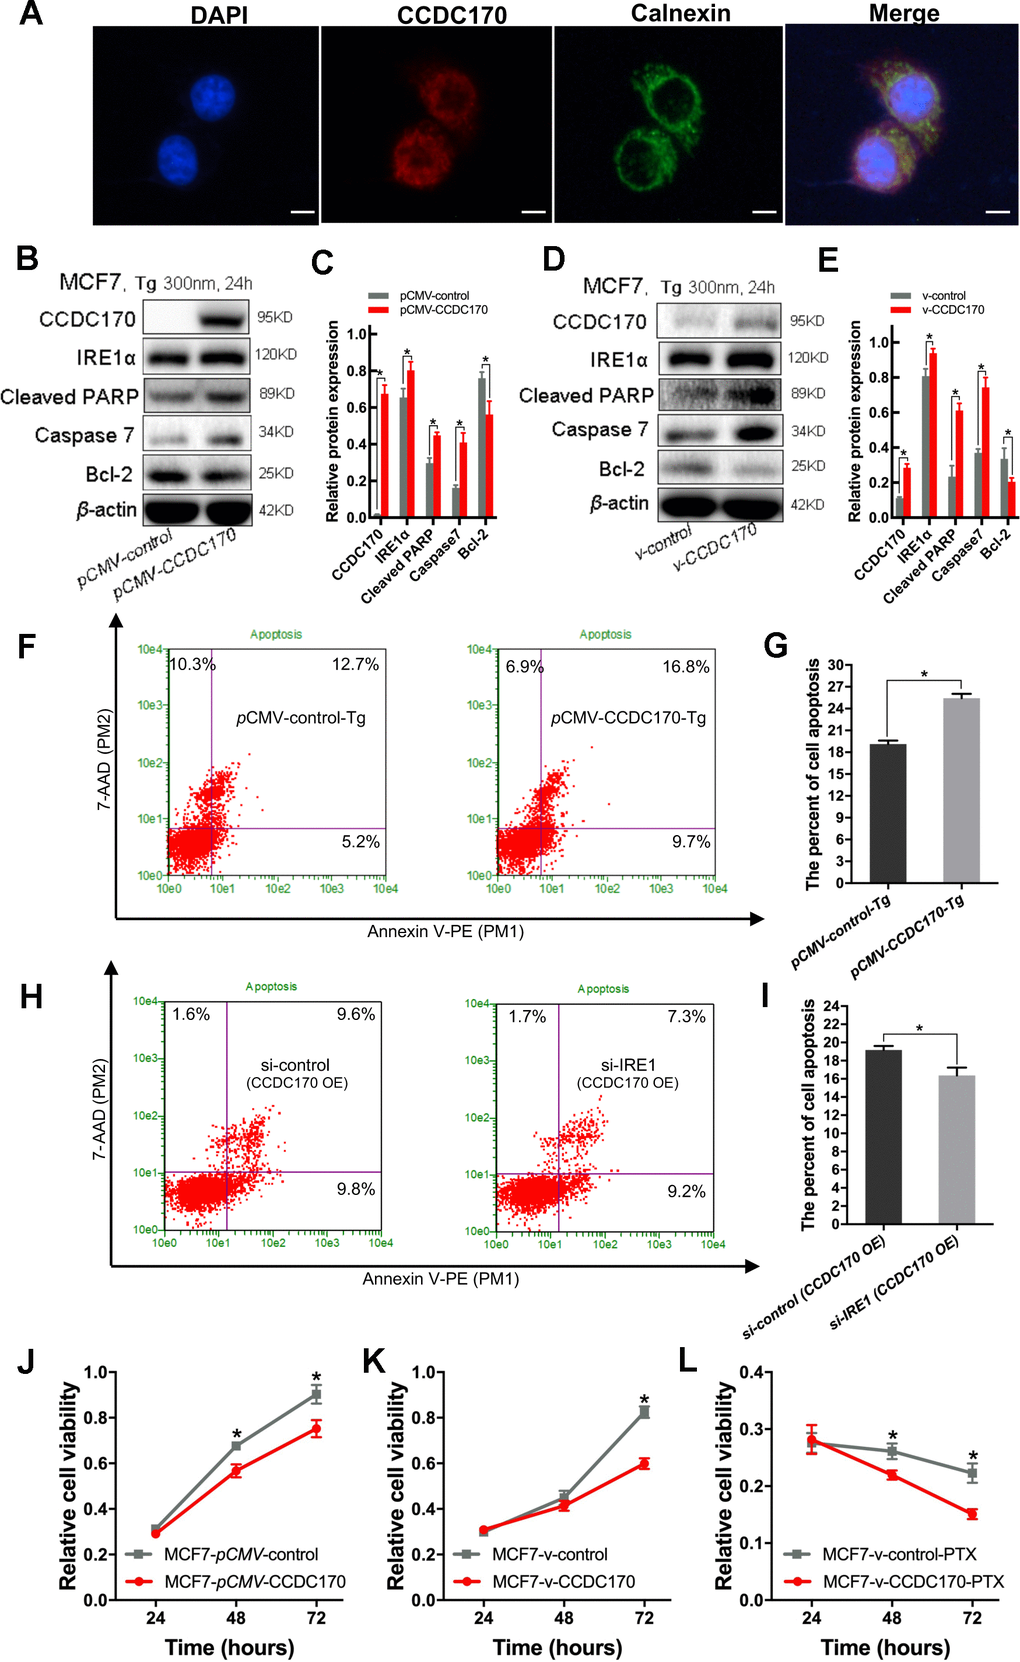
Figure 5.CCDC170 promoted cell apoptosis under ER stress. (A) IF showed that protein localization of CCDC70 overlapped Calnexin partially. Scale bar: 50μm. (B, D) Representative western blot bands of Cleaved PARP, Caspase7, Bcl-2 in MCF7 cells when CCDC170 up-regulated transiently (C) and stably (E) under TG treatment. pCMV-CCDC170(control) represented CCDC170-transiently-overexpressing MCF7 cells and controls. v-CCDC170(control) represented CCDC170-stably-overexpressing MCF7 cells and controls. β-actin was used as a reference for calculating the relative protein expression. TG: Thapsigargin (300nM). (F) Representative images of flow cytometry using Annexin V-FITC and PI staining, (G) Column bar graph showing an increased proportion of early and late apoptotic cells after CCDC170 overexpression in MCF7 cells treated with TG. 3000 cells were calculated. (H) Representative images of flow cytometry using Annexin V-FITC and PI staining, (I) Column bar graph showing a decreased proportion of early and late apoptotic cells after IRE1 knockdown in MCF7 cells with CCDC170 overexpression. 3000 cells were calculated. CCDC170 OE: MCF7 cells that transiently overexpressed CCDC170. Detection of cell viability via MTT assay. Transient (J) or stable (K) overexpression CCDC170, the growth of the cell was suppressed in MCF7 breast cancer cells. (L) The cell viability of CCDC170-stably-overexpressing MCF7 cells was significantly lower than that of control cells treated with PTX. PTX: paclitaxel (100nM). Each group was repeated at least three times. The error bars presented as mean ± Standard Error of Mean (SEM) with analysis of unpaired Student’s t-test. *P< 0.05, compared with the control group.