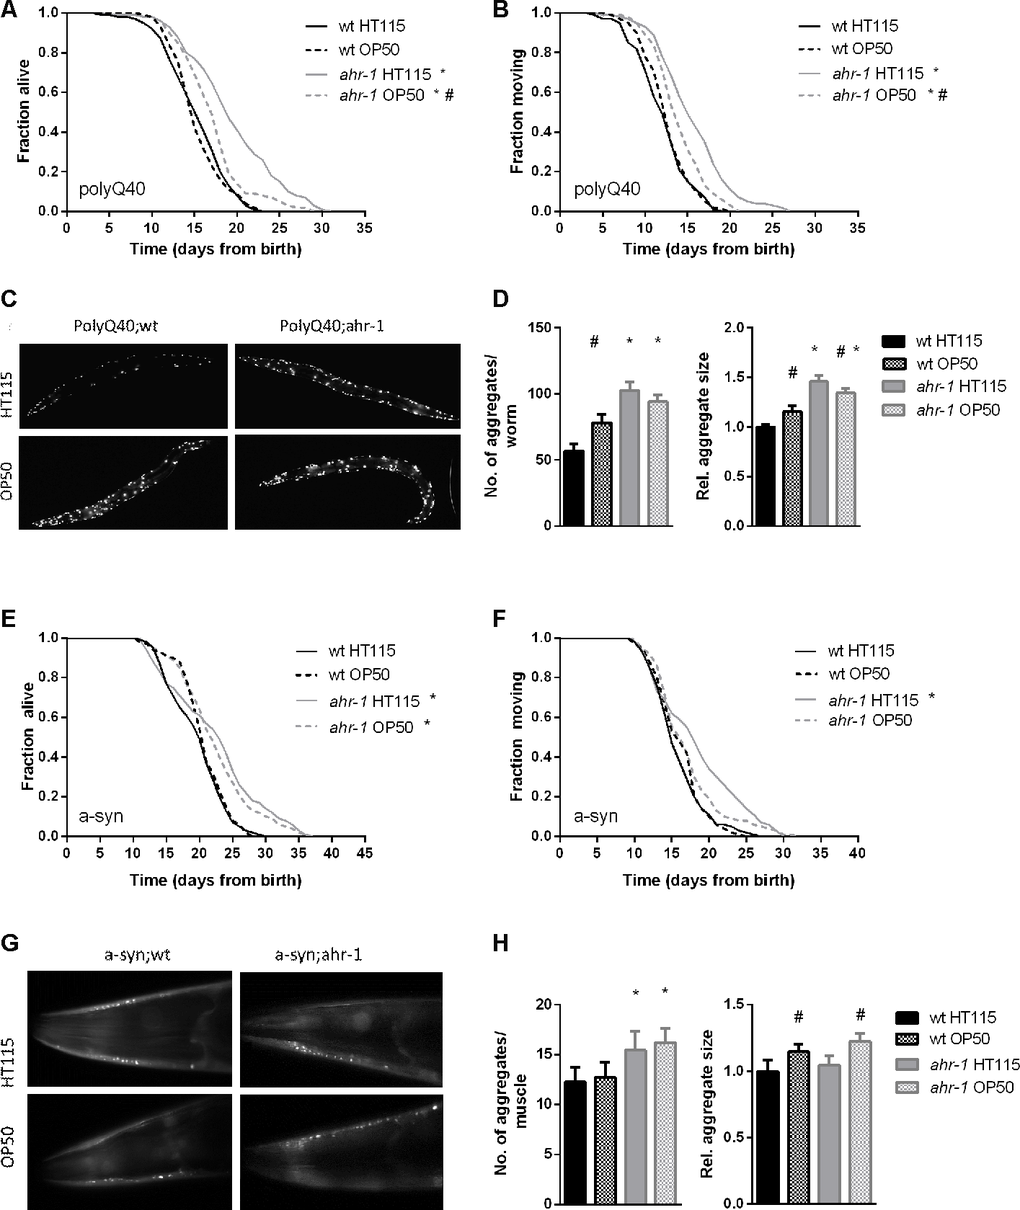
Figure 3.ahr-1 mutants increase aggregation but extend lifespan in a diet-dependent manner. (A, B) Kaplan Meier curves of polyQ;wt and polyQ;ahr-1 of 180 worms/condition in 3 independent experiments are shown. * p-value < 0.05 vs. polyQ;wt, # p-value < 0.05 vs. HT115, statistical test: Log-rank test. (C) Representative fluorescence images of 10-days old polyQ;wt and polyQ;ahr-1 on HT115 and OP50. (D) Quantification of aggregates in 10-days old polyQ;wt and polyQ;ahr-1. Mean + 95 % CI of pooled data from 34 (wt HT115), 29 (wt OP50), 26 (ahr-1 HT115), and 35 (ahr-1 OP50) worms in 3 independent replicates is shown. Statistical test: One-way ANOVA with Tukey’s multiple comparisons test, * p-value < 0.05 vs. polyQ;wt, # p-value < 0.05 vs. HT115. (E, F) Kaplan Meier curves of a-syn;wt and a-syn;ahr-1 of 120 worms/condition in 2 independent experiments are shown. * p-value < 0.05 vs. a-syn;wt, # p-value < 0.05 vs. HT115, statistical test: Log-rank test. (G) Representative fluorescence images of the head muscles of 7-days old a-syn;wt and a-syn;ahr-1 on HT115 and OP50. (H) Quantification of aggregates in 7- days old a-syn;wt and a-syn;ahr-1. Mean + 95 % CI of pooled data from 77 (wt HT115), 82 (wt OP50), 88 (ahr-1 HT115), and 92 (ahr-1 OP50) worms in 3 independent replicates is shown. Statistical test: One-way ANOVA with Tukey’s multiple comparisons test, * p-value < 0.05 vs. a-syn;wt, # p-value < 0.05 vs. HT115.