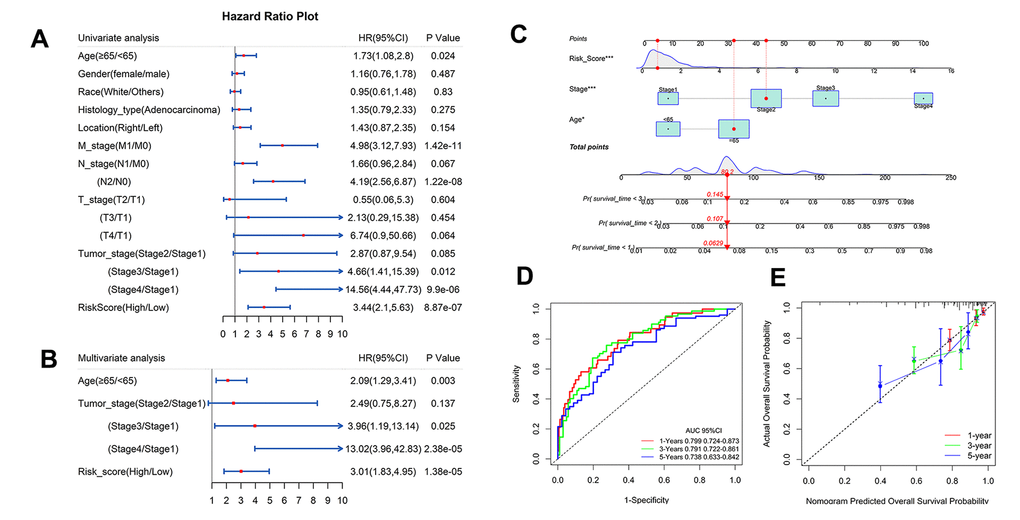
Figure 9.Independent analysis of IRG and construction of nomogram and performance assessment. (A, B) Univariate and multivariate Cox regression analysis of prognostic factors in TCGA. (C) Nomogram based on clinical factors and risk grads in TCGA. (D) AUC values for 1-, 3-, and 5-year survival rates in a nomogram. (E) Calibration for the possibility of 1-, 3-, and 5-year survival in a nomogram.