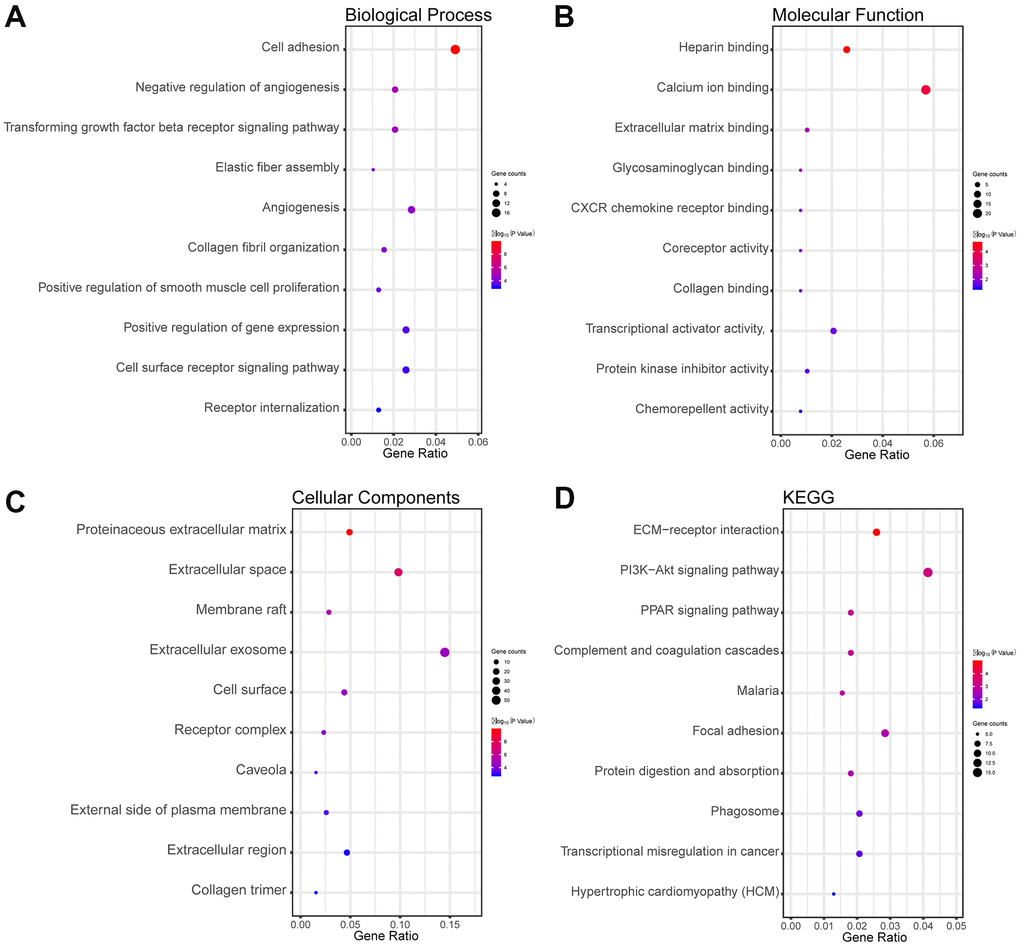
Figure 2.Functional and pathway enrichment analyses of the overlapping DEGs in LUAD. (A) The BP analysis of DEGs. (B) The MF analysis of DEGs. (C) The CC analysis of DEGs. (D) The KEGG pathway analyses of DEGs. The x-axis represents the q value (−log10), and the y-axis represents the GO term. The GO terms were measured by the rich factor, q value, and number of genes enriched. The greater the rich factor, the greater is the degree of enrichment and the greater the P value [0, 1]. The brighter the color of red, the more significant is the term.