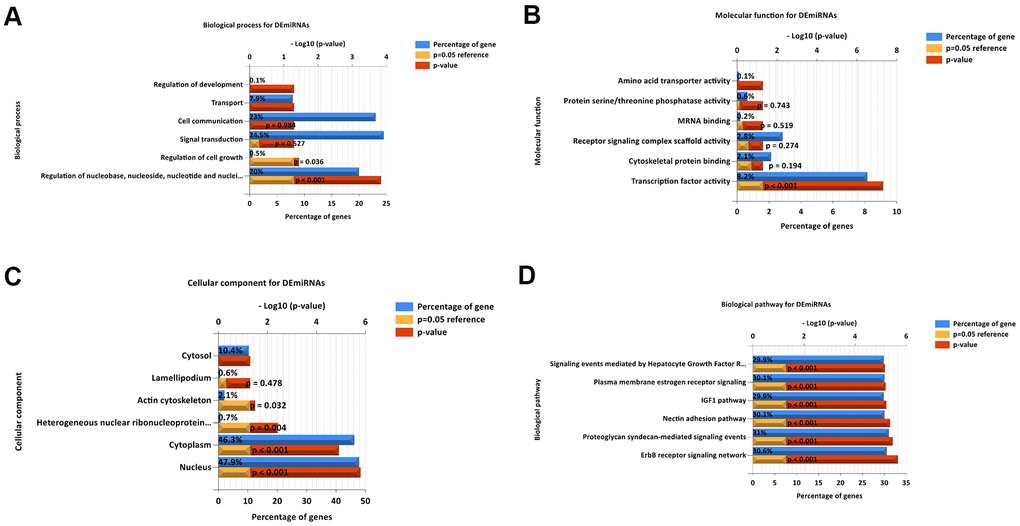
Figure 3.Functional and pathway enrichment analyses of the DEMs in LUAD. (A) The BP analysis of DEMs. (B) the MF analysis of DEMs. (C) The CC analysis of DEMs. (D) The biological pathway analysis of DEMs. The upper x-axis represents the P value (−log10), and the lower x-axis represents the percentage of genes (blue). The y-axis represents the GO term. Yellow represents a P = 0.05 as reference, and red represents the specific P value. The longer the rectangular zone, the smaller is the P value.