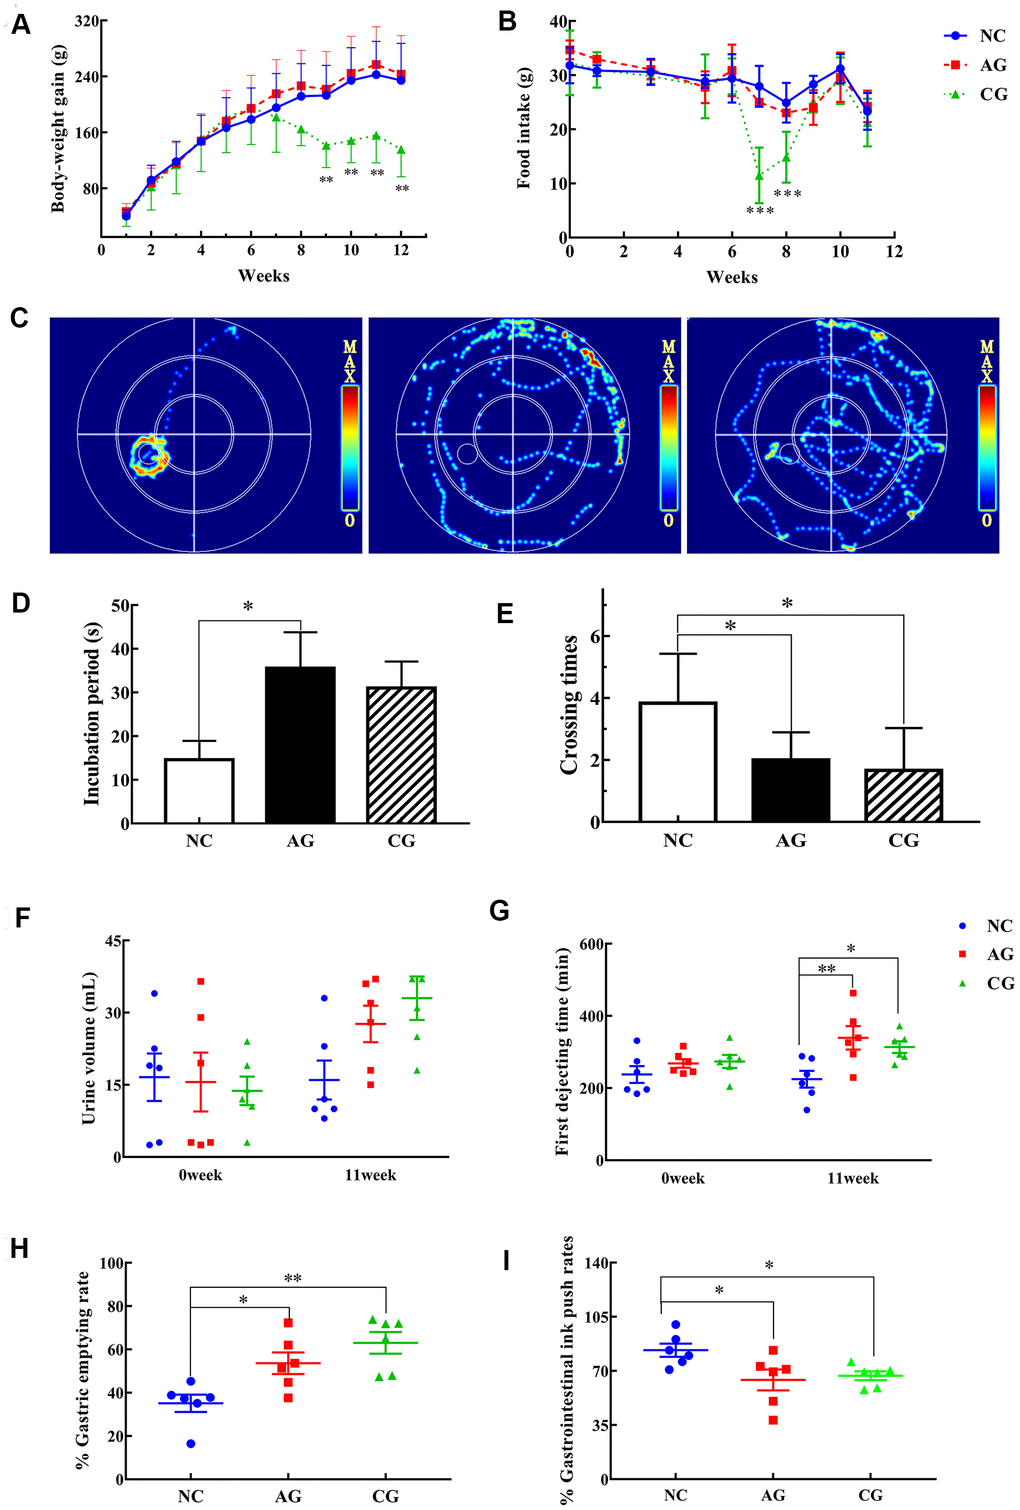
Figure 1.The results of behavioristics based on the negative control group (NC), the aging model group (AG) and the constipation model group (CG). (A) Body-weight gain; (B) Food intake; (C) Typical swimming heat map on the spatial probe ability of rats in the fourth day; (D) Escape latency; (E) The number of crossing the platform; (F) Urine volume collected for 12 hours; (G) First dejecting time; (H) Gastric emptying rates; (I) Gastrointestinal ink push rates. Data were presented as the mean ± S.E. (n=6). *P < 0.05, **P < 0.01, compared with NC.