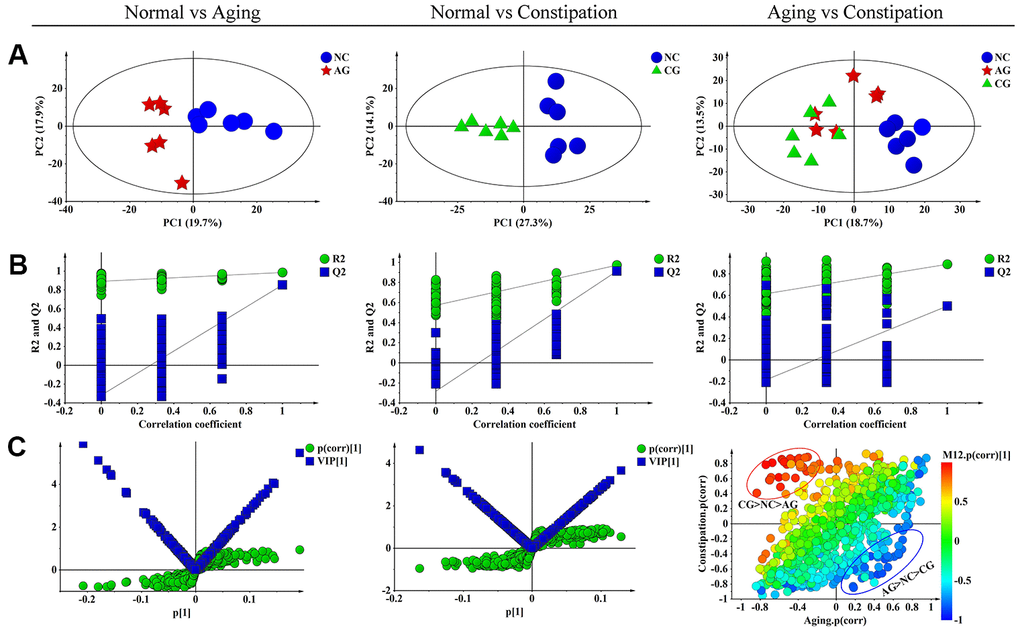
Figure 4.Multivariate data analysis of 1H NMR fecal extract spectra among the negative control group (NC), the aging model group (AG) and the constipation model group (CG). (A) PCA scores plot of fecal specimens based on NC (blue dots), AG (red boxes) and CG (green triangles). (B) Statistical validation of the corresponding PLS-DA model by permutation analysis (permutation No.: 200). R2 is the explained variance, and Q2 is the predictive ability of the model. (C) The corresponding S-plot and VIP value of fecal specimens in aging and constipation, as well as SUS-plot plots showing the discriminations between aging and constipation. PCA, principal component analysis; PLS-DA, partial least squares discriminant analysis; SUS-plot, shared-and-unique-structures plot.