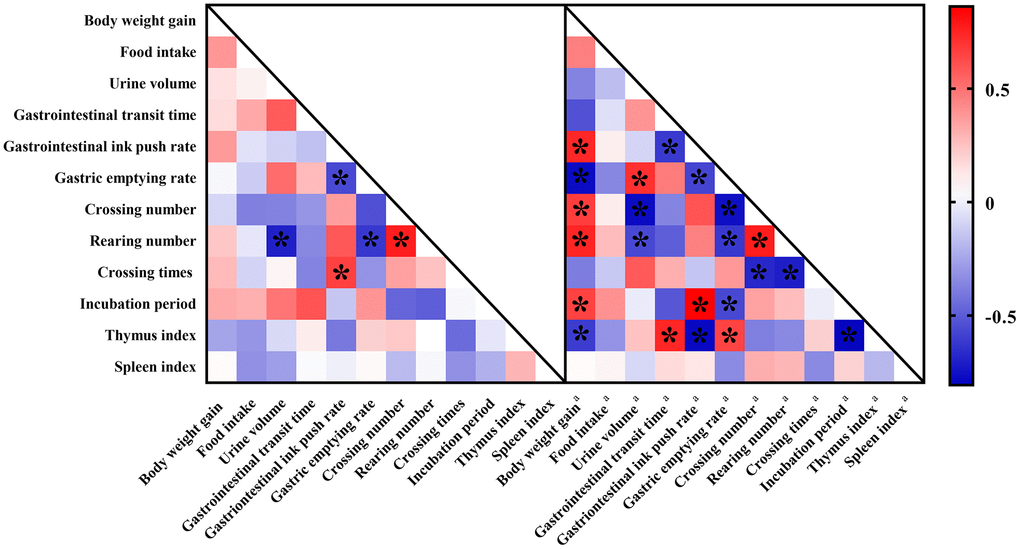
Figure 6.Correlation heat map color-coded by the strengths of Pearson correlation coefficients (r) between behaviors. Cut-off values of |r| > 0.5 and P < 0.05 have been used. “*” means significantly differences. Red boxes indicate positive associations while blue boxes indicate negative associations. Parameters labeled with “a” indicated fecal biomarkers involving in constipation while metabolites without any labels indicated fecal biomarkers involving in aging.