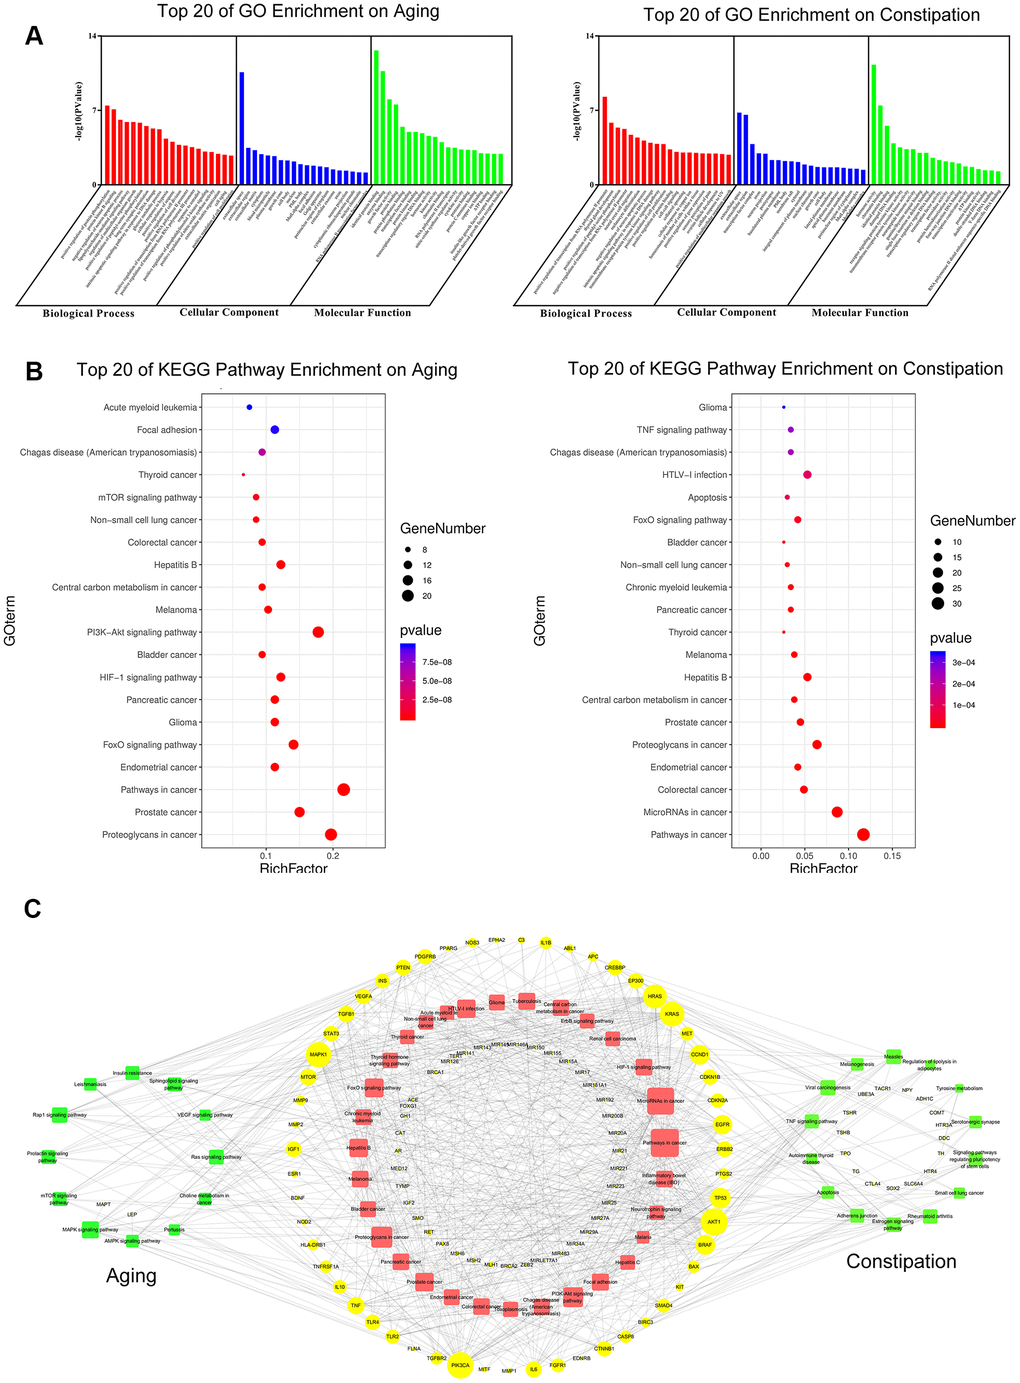
Figure 7.GO enrichment analysis (A) and KEGG pathway analysis (B) of potential targets of aging and constipation. The size of the bubbles in each bubble chart represents the gene counts of this entry. The colors from cold to warm represent the P values from large to small. Each bubble chart is sorted by P value. GO: gene ontology; KEGG: kyoto encyclopedia of genes and genomes. (C) The target-pathway network diagram of aging and constipation. The yellow labels and the blue labels represent disease targets and signing pathways, respectively. The red labels and the green labels represent the common signaling pathways between aging and constipation, and the unique disease targets for aging or constipation, respectively. The size of each label represents its degree. The thickness and color of the lines represent edge. The edges represent the interactions between them and node sizes are proportional to their degree. The blue nodes and the red nodes represent targets pathways, respectively.