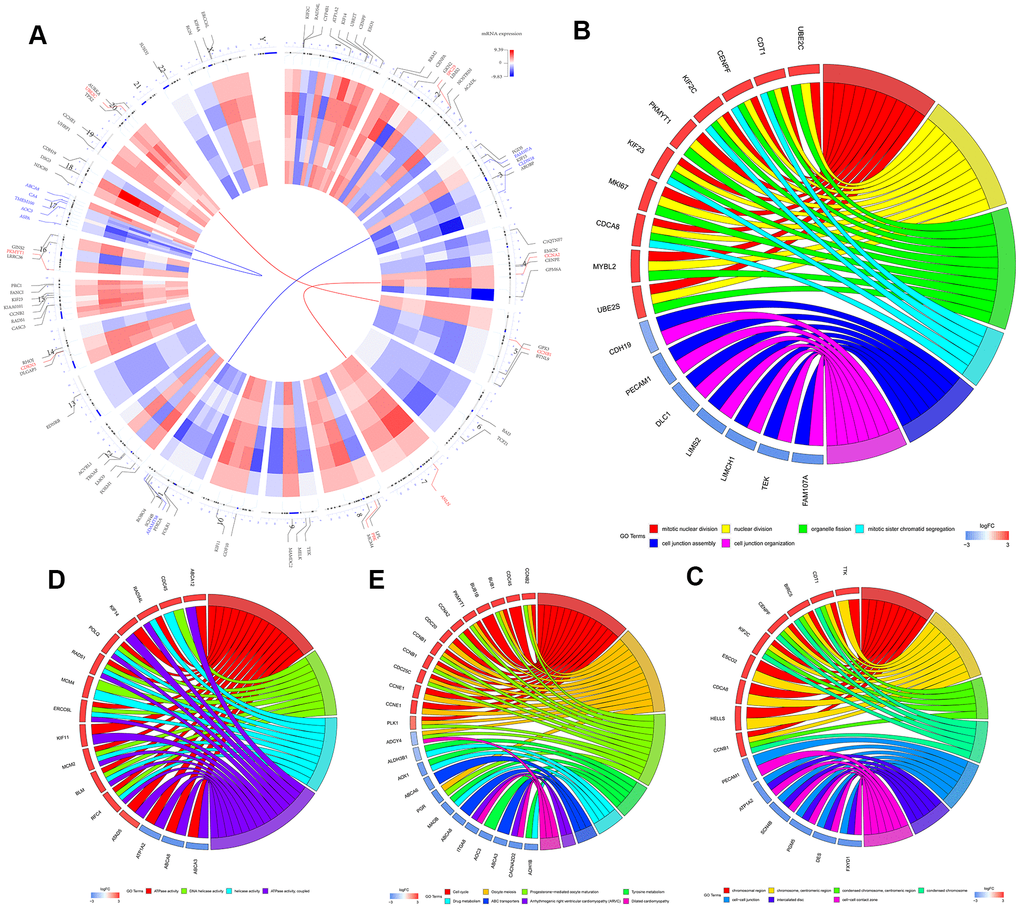
Figure 2.Identification and functional enrichment analysis of robust DEGS in five GEO-LUSC datasets. (A) The circular heatmaps show the differential expressed genes (DEGs) in the five GEO-LUSC datasets, which are shown in the inner circle. The upregulated genes are shown in red and the downregulated genes are represented in blue. Genes that are not present in a given dataset are shown in white. The outer circle represents the chromosomes. The lines indicate their specific chromosomal locations of each gene. The top 4 up-regulated and down-regulated genes according to the adjusted P values are shown in red and blue, respectively and are connected by the red and blue lines to the center of the circles. (B) The chord plot shows the relationship between the top 300 DEGs and the GO terms related to the biological processes (BP). (C) The chord plot depicts the relationship between the top 300 DEGs and the GO terms related to the cellular components (CC). (D) The chord plot depicts the relationship between the top 300 DEGs and the GO terms related to the molecular functions (MF). (E) The chord plot depicts the relationship between the top 300 DEGs and the KEGG pathways.