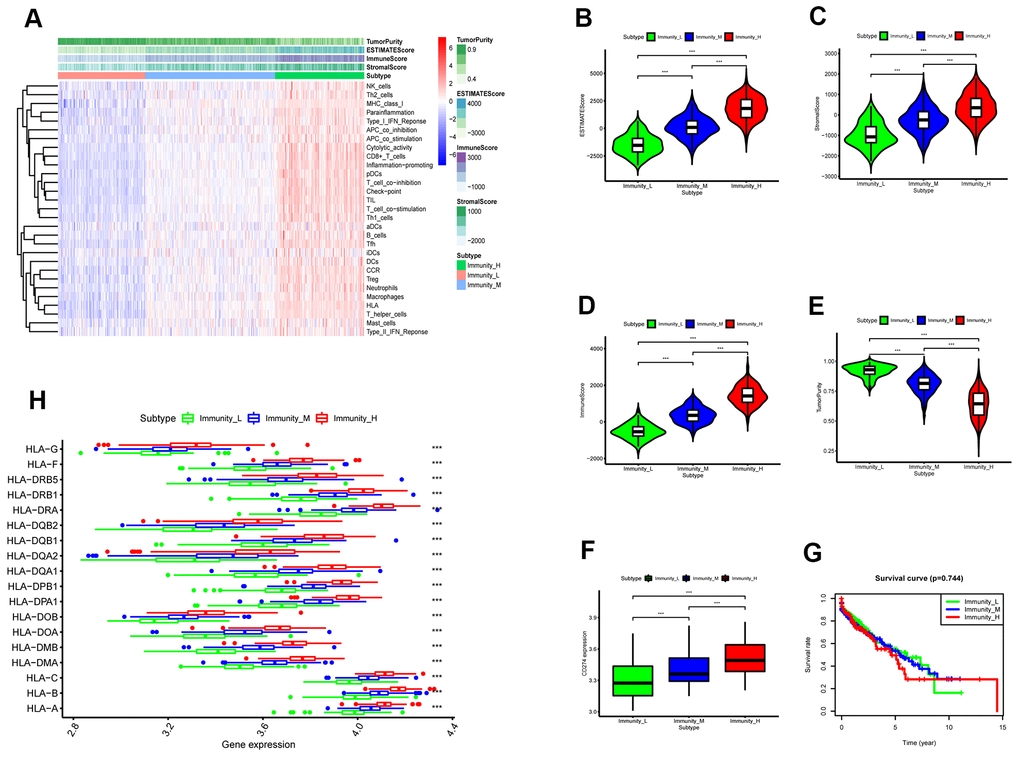
Figure 3.ESTIMATE analysis of three immunity-related subtypes in the TCGA-LUSC samples based on ssGSEA scores. (A) Hierarchical clustering of TGCA-LUSC samples based on the ssGSEA scores generated by analyzing the expression levels of the immunity-related gene sets. The data shows three distinct LUSC subgroups: high immunity, medium immunity, and low immunity. (B) ESTIMATE analyses of tumor purity, stromal scores, and immune scores of the high, medium, and low immunity groups of LUSC patient samples. Histogram plot shows the ESTIMATE scores of the three LUSC subgroups (Mann–Whitney U test, p<0.001). (C) Histogram plot shows the stromal scores of the three LUSC subgroups (Mann–Whitney U test, p<0.001). (D) Histogram plot shows the immune scores of the three LUSC subtypes (Mann–Whitney U test, p<0.001). (E) Histogram plot shows the tumor purity levels of the three LUSC subgroups (Mann–Whitney U test, p<0.001). (F) Histogram plot shows the PD-L1 expression levels of the three LUSC subgroups (ANOVA test, p<0.001).(G) Kaplan-Meier survival curve analysis shows the overall survival times of the LUSC patients belonging to the three LUSC subgroups (log-rank test: P>0.05). (H) Histogram plot shows the expression levels of HLA genes of the three LUSC patient subgroups (ANOVA, P<0.05). (G) Histogram plot shows the TOX expression levels of the three LUSC subgroups (ANOVA, P<0.05). Note: Immunity_H denotes high immunity group; Immunity_M denotes medium immunity group; Immunity_L denotes low immunity group.