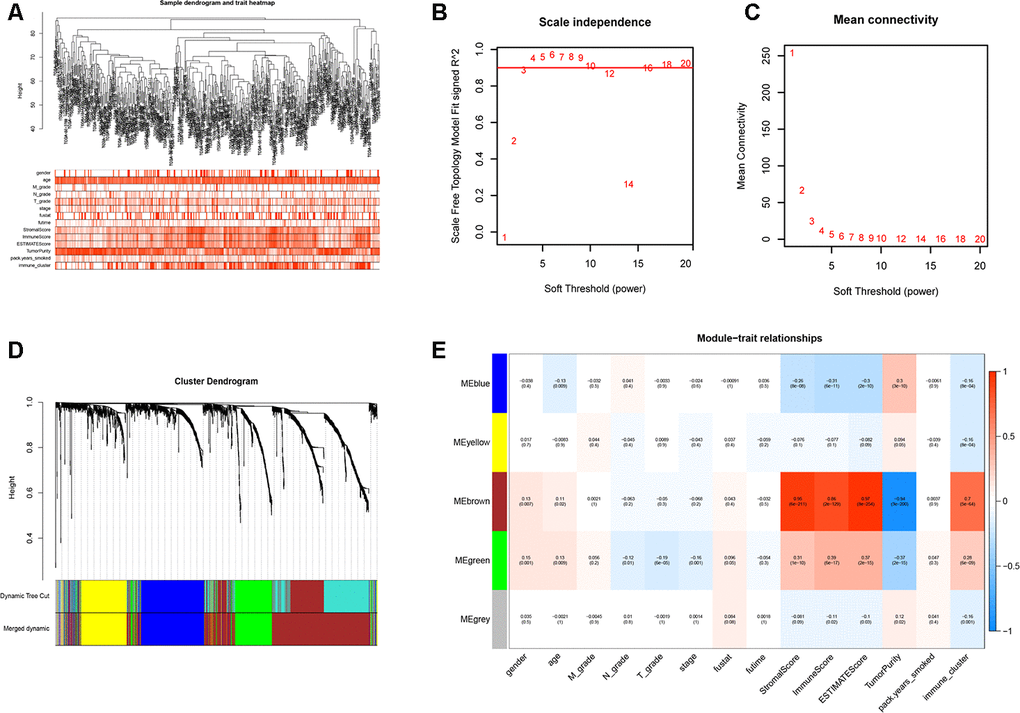
Figure 5.Weighted gene correlation network analysis to identify key immunity-related gene modules in the TCGA-LUSC dataset and their correlation with the LUSC-related clinicopathological traits. (A) The clustering dendrograms of robust DEGs identified by the RRA analysis in the TCGA-LUSC samples. The color intensity varies according to the clinicopathological characteristics such as age, TNM grades, stage and smoking history (smoking packs per year), immune scores, tumor purity, stromal scores and immunity subtypes (high, medium or low immunity subgroups). The red color indicates biochemical recurrence and white indicates absence of biochemical recurrence. For gender, red color denotes female and white color denotes male. (B, C) Network topology analyses for various soft-thresholding powers. The left panel shows the scale-free fit index (y-axis) as a function of soft-thresholding power (x-axis). The right panel shows the mean connectivity (degree, y-axis) as a function of soft-thresholding power. (D) The clustering dendrogram of all DEGs with dissimilarity measures based on topological overlap measure (TOM) together with assigned module colors. The non-clustering DEGs are shown in gray. (E) The heatmap shows the correlation between module eigengenes and the clinicopathological traits of LUSC. Each column contains the corresponding correlation coefficient and P value.