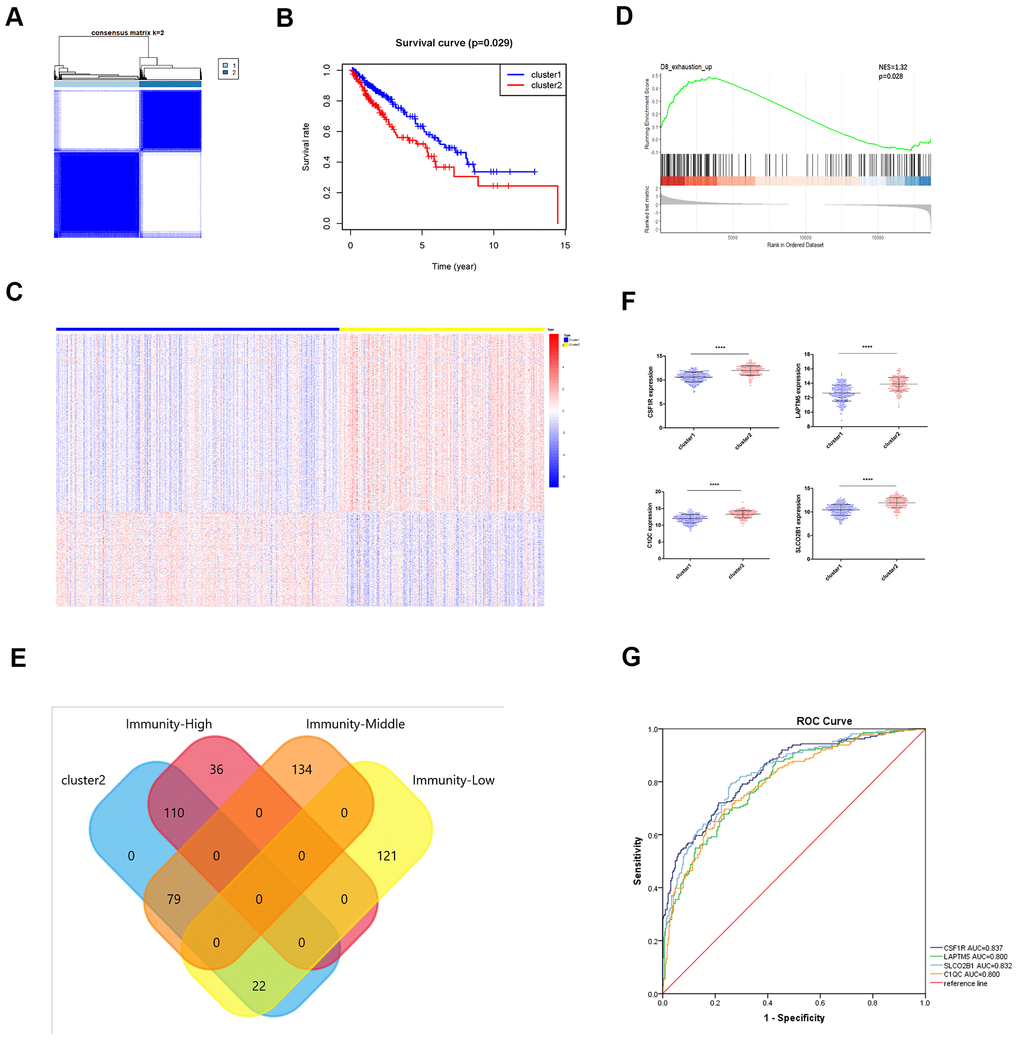
Figure 8.Identification of immunity-based molecular subtypes of LUSC patient samples based on the expression of the TOX pathway gene signature. (A) Clustering heat map shows the presence of two clusters among the TCGA-LUSC dataset based on the TOX pathway gene signature. (B) Kaplan–Meier survival curve analysis shows the differences in overall, survival times of cluster 1 and cluster 2 TCGA-LUSC patients. (C) The heatmap shows the expression of DEGs in the cluster 1 and cluster 2 TCGA-LUSC patients. (D) GSEA plot shows the upregulation of genes related to the exhausted CD8+ T cells in the cluster 2 TCGA-LUSC dataset compared to those in the cluster1 TCGA-LUSC dataset. The upregulated genes linked to the exhaustion of CD8+ T cells are shown on the left. Note: NES: normalized enrichment score. (E) Venn diagram shows the numbers of cluster 1 (n=36) and cluster 2 (n=110) molecular subtypes among the high immunity LUSC subgroup (n=146). (F) The histogram plots show the mRNA expression levels of LAPTM5, CSF1R, SLCO2B1 and C1QC in the cluster 1 and cluster 2 LUSC samples. (G) ROC curve analysis shows the sensitivity and accuracy of the 4 hub genes, LAPTM5, CSF1R, SLCO2B1 and C1QC to distinguish cluster 1 and cluster 2 samples based on their expression. The area under the ROC curve (AUC) values demonstrates that all 4 hub genes show high sensitivity and accuracy in distinguishing the LUSC patients belonging to the two clusters. Note: Immunity-High denotes high immunity group; Immunity-Middle denotes medium immunity group; Immunity-Low denotes low immunity group.