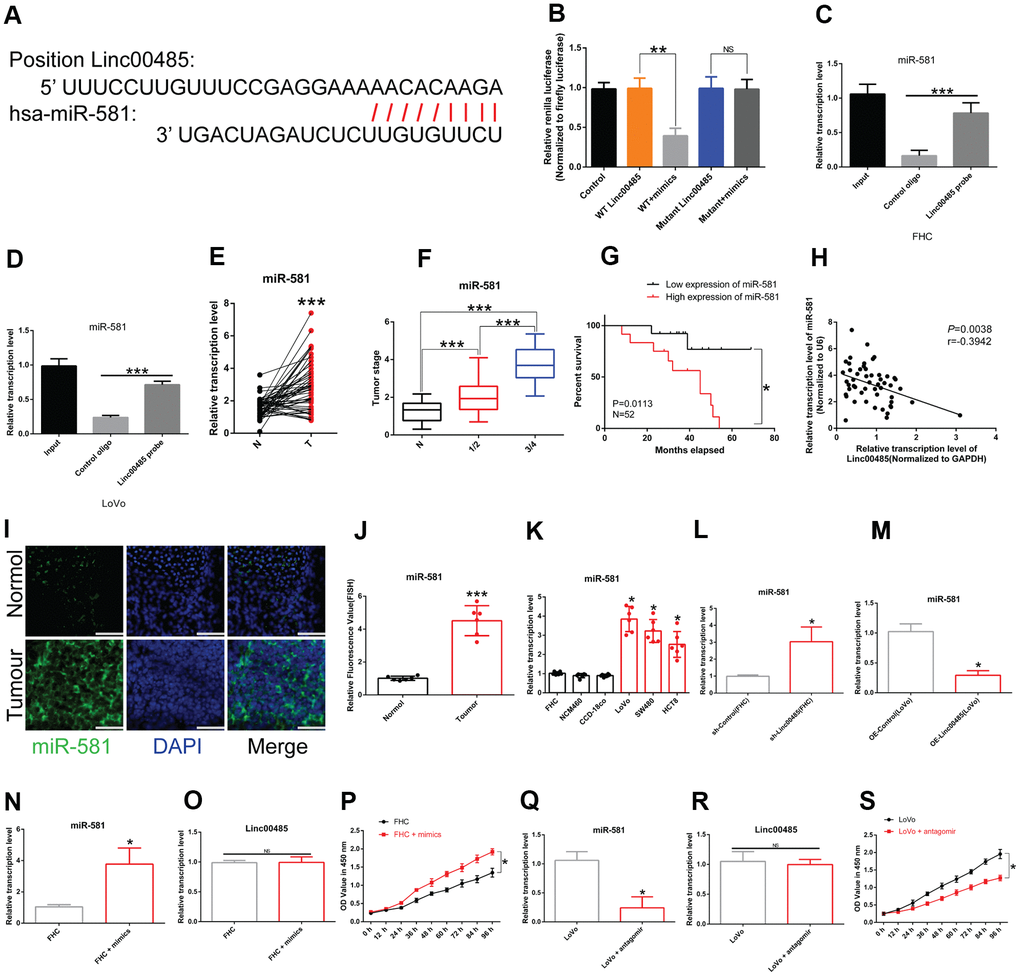
Figure 2.LINC00485 directly targets miR-581. (A) Predicted binding sites between LINC00485 and miR-581. (B) The interaction between LINC00485 and miR-581 was confirmed by luciferase reporter assays in 293T cells. (C, D) The RIP assay was performed to validate the interaction between LINC00485 and miR-581 in (C) FHC cells and (D) LoVo cells. (E) miR-581 levels in CRC and adjacent normal tissues. (F) miR-581 levels in CRC patients with stage I/II or III/IV disease is significantly higher than in adjacent normal tissues. (G) High expression of miR-581 predicts poor outcome of CRC patients. (H) The expression of miR-581 is negatively correlated with LINC00485 level in human tumor tissues. (I) The subcellular localization of miR-581 in CRC and normal tissues. Blue, DAPI; Green, miR-581; Scale bar, 50 μm. (J) Fluorescence value of miR-581 expression in tumor and normal tissues. (K) miR-581 expression is significantly elevated in CRC cells compared to the human normal colorectal epithelial cell lines. (L) The expression of miR-581 is significantly elevated in LINC00485 knockdown FHC cells. (M) The expression level of miR-581 is downregulated in LINC00485-overexpressing LoVo cells. (N) Transfection efficiency of miR-581 mimics in FHC cells was determined by RT-qPCR. (O) Treatment with miR-581 mimics has no effect on LINC00485 expression in FHC cells. (P) Treatment with miR-581 mimics increases FHC cell viability. (Q) Transfection efficiency of miR-581 antagomir in LoVo cells was measured by RT-qPCR. (R) Treatment with miR-581 antagomir has no effect on the expression level of LINC00485 in LoVo cells. (S) miR-581 knockdown reduces LoVo cell viability. Differences between two groups were assessed by applying student’s t-test. Multiple comparison was analyzed using the one-way ANOVA with LSD test. Bars were represented as S.D. *P<0.05; **P<0.01; ***P<0.001. N, paired normal tissues; T, tumor tissues.