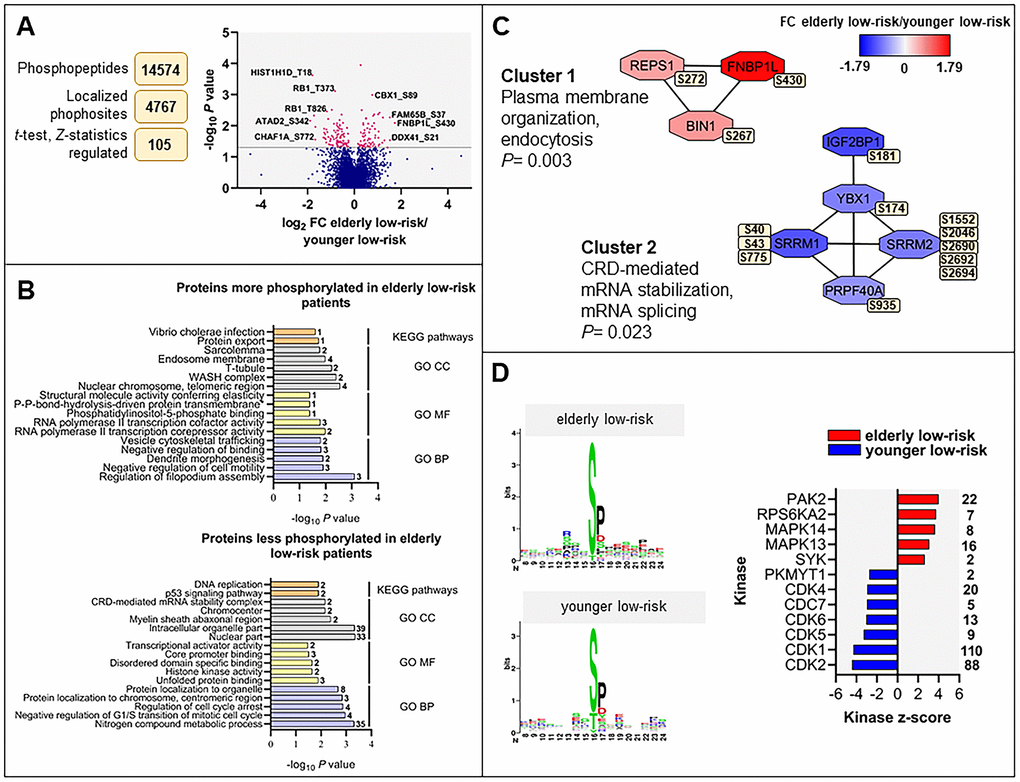
Figure 3.The regulated phosphoproteome in the study of elderly low-risk vs younger low-risk patients. (A) Overview of phosphoproteomic data analysis from elderly low-risk and younger low-risk patient samples. Volcano plot analysis of phosphosites quantified in at least five patients per group. Points (in magenta) above the non-axial horizontal grey line represent phosphosites with significantly different phosphorylation levels (P <0.05). (B) GO (BP terms with lilac bars; CC terms with light grey bars; MF terms with yellow bars) and KEGG pathways (orange bars) analyses of proteins with increased and decreased phosphorylation in elderly low-risk patients. The various enriched GO terms and KEGG pathways are displayed on the y-axis while the corresponding –log10P values are shown on the x-axis. The number of genes associated to a specific GO term or KEGG pathway is shown on the right side of the corresponding bar. (C) Networks of protein-protein interactions (PPI) based on STRING database and visualized in Cytoscape after ClusterONE analysis. The significance of networks with high cohesiveness is shown with the P value of a one-sided Mann-Whitney U test. The differentially regulated phosphorylation sites are shown in yellow boxes next to each protein. FC of phosphorylation are color-coded; red-colored proteins showed a higher phosphorylation in elderly low-risk patients and blue-colored proteins showed a higher phosphorylation in the younger low-risk group. (D) Sequence motif analysis of the ± eight amino acids flanking the differentially regulated phosphorylation sites for each patient group and kinase-substrate enrichment analysis (KSEA) of differentially regulated and unregulated phosphorylation sites. The kinase z-score (x-axis) is the normalized score for each kinase (y-axis), weighted by the number of identified substrates indicated on the right side of the plot. Only significant predicted kinases with false discovery rate (FDR) values <0.05 were shown.