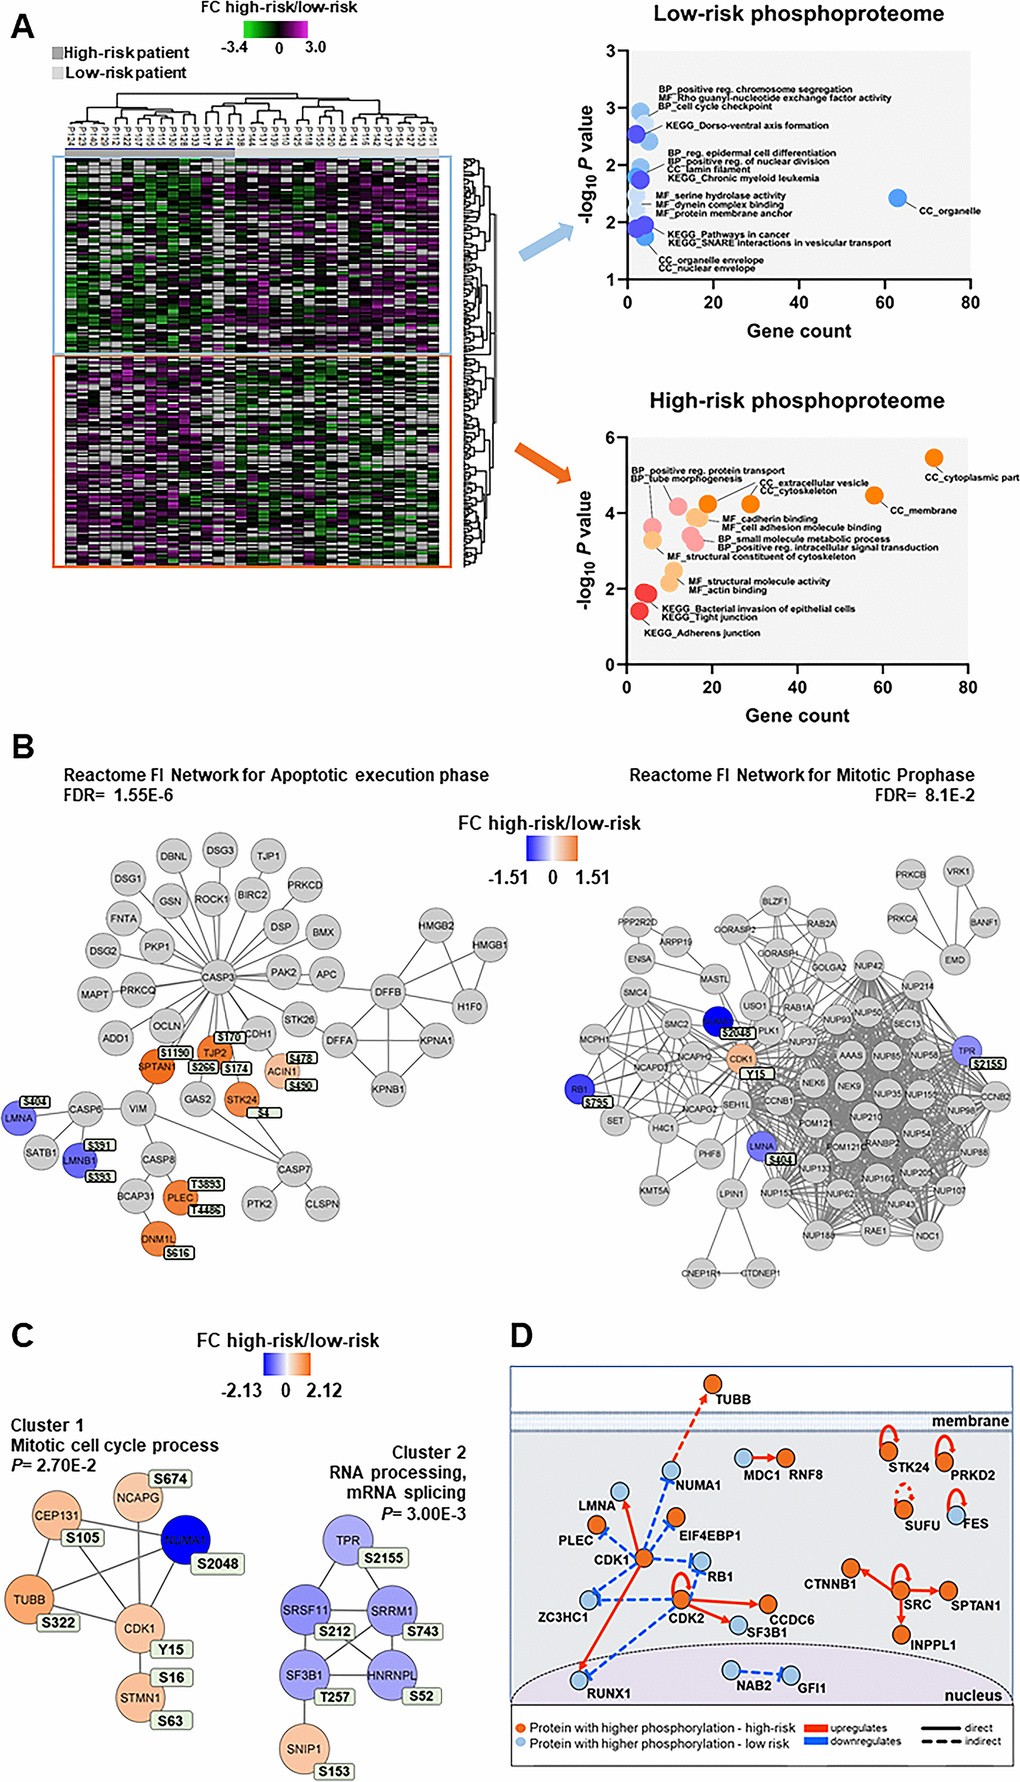
Figure 5.Phosphoproteomic differences between high-risk and low-risk patients; the importance of the cytoskeleton, mitotic cell cycle regulation and CDK activities. (A) Hierarchical clustering of the 33 patients based on the phosphorylation level (SILAC log2 ratio) of 239 phosphosites with significant differences between high-risk and low-risk patient samples. Two vertical main clusters were observed, one dominated by phosphosites with higher phosphorylation in low-risk patients (upper cluster) and the other by phosphosites with higher phosphorylation in high-risk patients (lower cluster). GO and KEGG pathways analyses of the two corresponding phosphoprotein clusters were performed to reveal enriched BP, CC and MF terms in the high-risk and low-risk patient samples. The various enriched GO terms and KEGG pathways are displayed in the scatter plot. The number of genes associated to a specific GO term or KEGG pathways (count) and the corresponding –log10P values are shown on the x-axis and y-axis, respectively. Abbreviations were used in cases of long GO term or KEGG pathway name (reg. for regulation). (B) Visualization of hit Reactome pathways was performed using the ReactomeFIViz app (7.2.3) in Cytoscape. Two significant Reactome networks (FDR <0.05) that mapped phosphoproteins with differential phosphorylation in our dataset are shown. The protein nodes are colored according to their high-risk vs low-risk log2 phosphorylation FC, i.e. orange indicates increased phosphorylation in the high-risk group and blue increased phosphorylation in the low-risk group. (C) Networks of PPI based on STRING database and visualized in Cytoscape after ClusterONE analysis. The significance of networks with high cohesiveness is shown with the P value of a one-sided Mann-Whitney U test. The differentially regulated phosphorylation sites are shown in light green boxes next to each protein. FC of phosphorylation are color-coded; orange-colored proteins showed a higher phosphorylation in the high-risk group and blue-colored proteins showed a higher phosphorylation in the low-risk group. (D) Causal relationships between phosphoproteins with differentially regulated phosphorylation sites in the high-risk vs low-risk phosphoproteome set was studied with SIGNOR. The analysis showed the pivotal role of CDKs in the control of cell cycle, cytoskeleton and translation phosphoproteins. Nodes and types of relationships are displayed as indicated on the bottom part of the design.