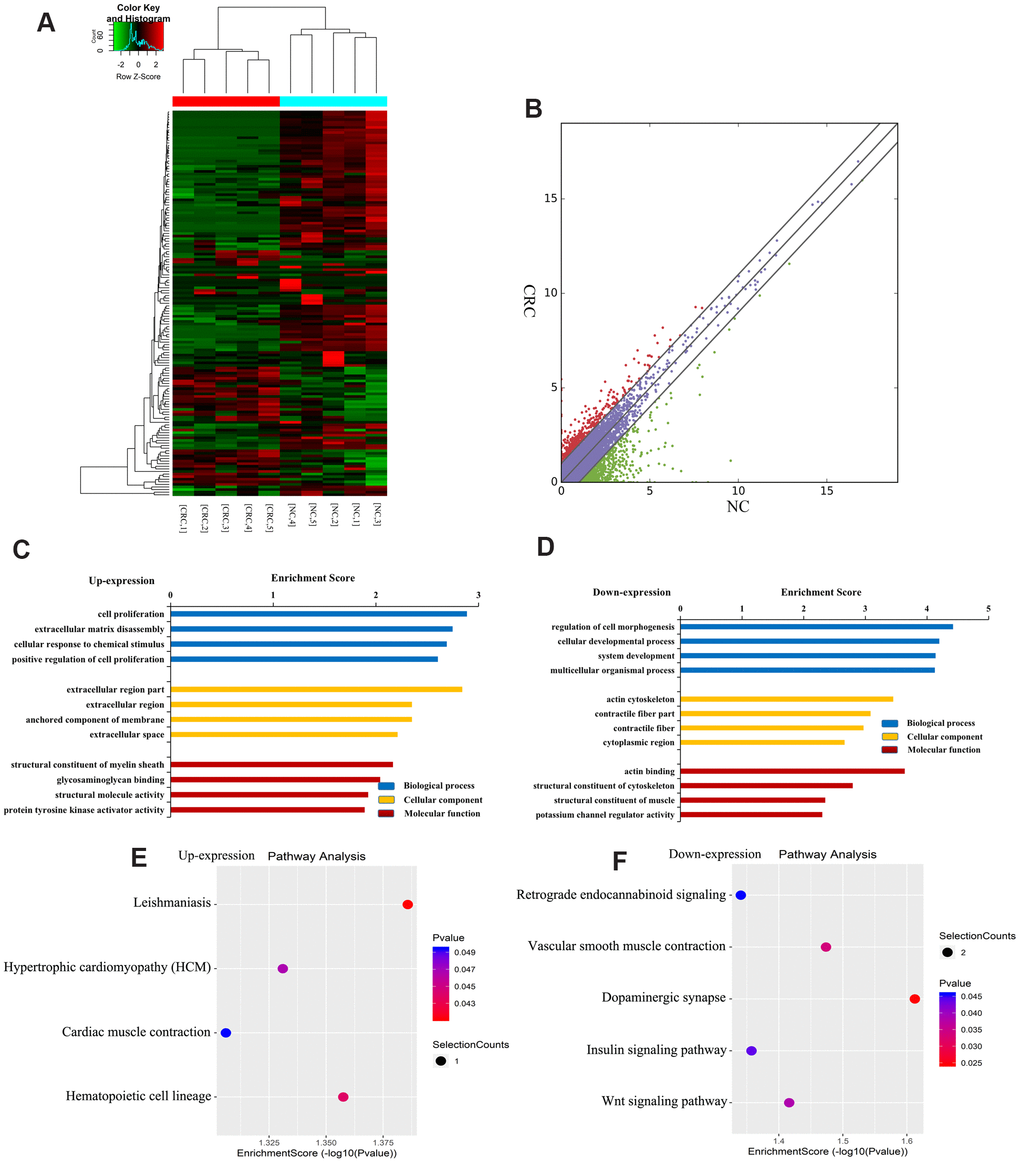
Figure 4.Identification of differentially expressed lncRNAs in CRC. (A) Heat map of RNA sequencing data from CRC and tumor-adjacent normal tissues. Rows: lncRNAs; columns: CRC and tumor-adjacent normal tissue samples. Red, green, and black indicate the upregulation, unchanged expression, and downregulation of lncRNAs, respectively. (B) Scatter plot of RNA sequencing data. GO enrichment analysis of genes near upregulated (C) and downregulated (D) lncRNAs. GO enrichment analysis included biological process (BP) analysis, cellular component (CC) analysis, and molecular function (MF) analysis. KEGG pathway analysis of genes near upregulated (E) and downregulated (F) lncRNAs. p-values were calculated using DAVID.