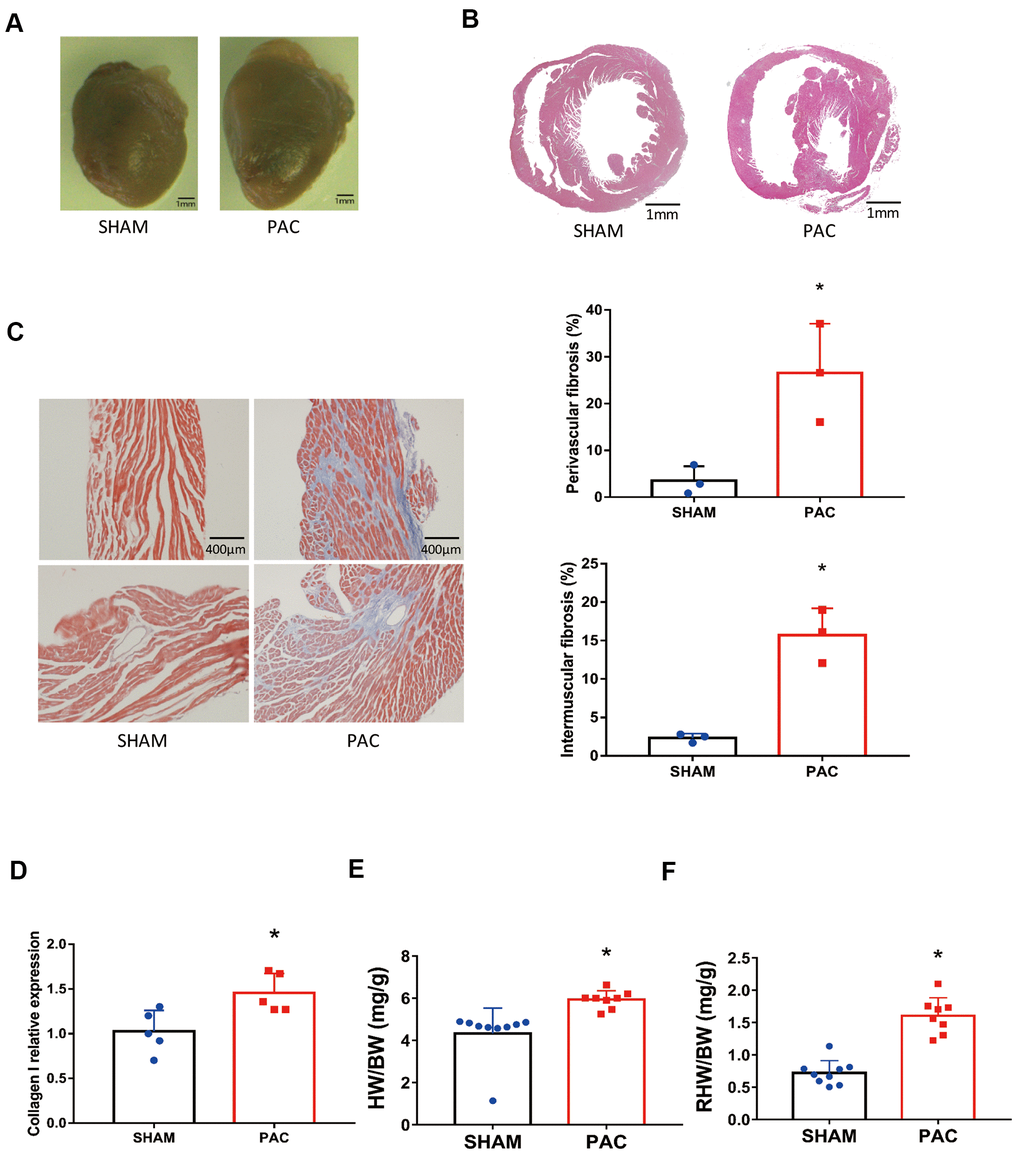
Figure 1.Pulmonary artery constriction induced right ventricular (RV) morphology alterations. (A) Representative right ventricular hypertrophy at 4 weeks after pulmonary artery constriction (PAC). (B) Hematoxylin and eosin (H&E) staining of RV tissue. (C) Azan-Masson staining of the RV in intermuscular and perivascular parts and their corresponding fibrotic area percentage. (D) Gene expression level of collagen I. (E) The heart weight to body weight ratio (HW/BW). (F) The right heart weight to body weight ratio (RHW/BW). *P < 0.05 vs the corresponding sham group; Scale bar=1 mm for panels A and B, scale bar = 400 μm for panel C.