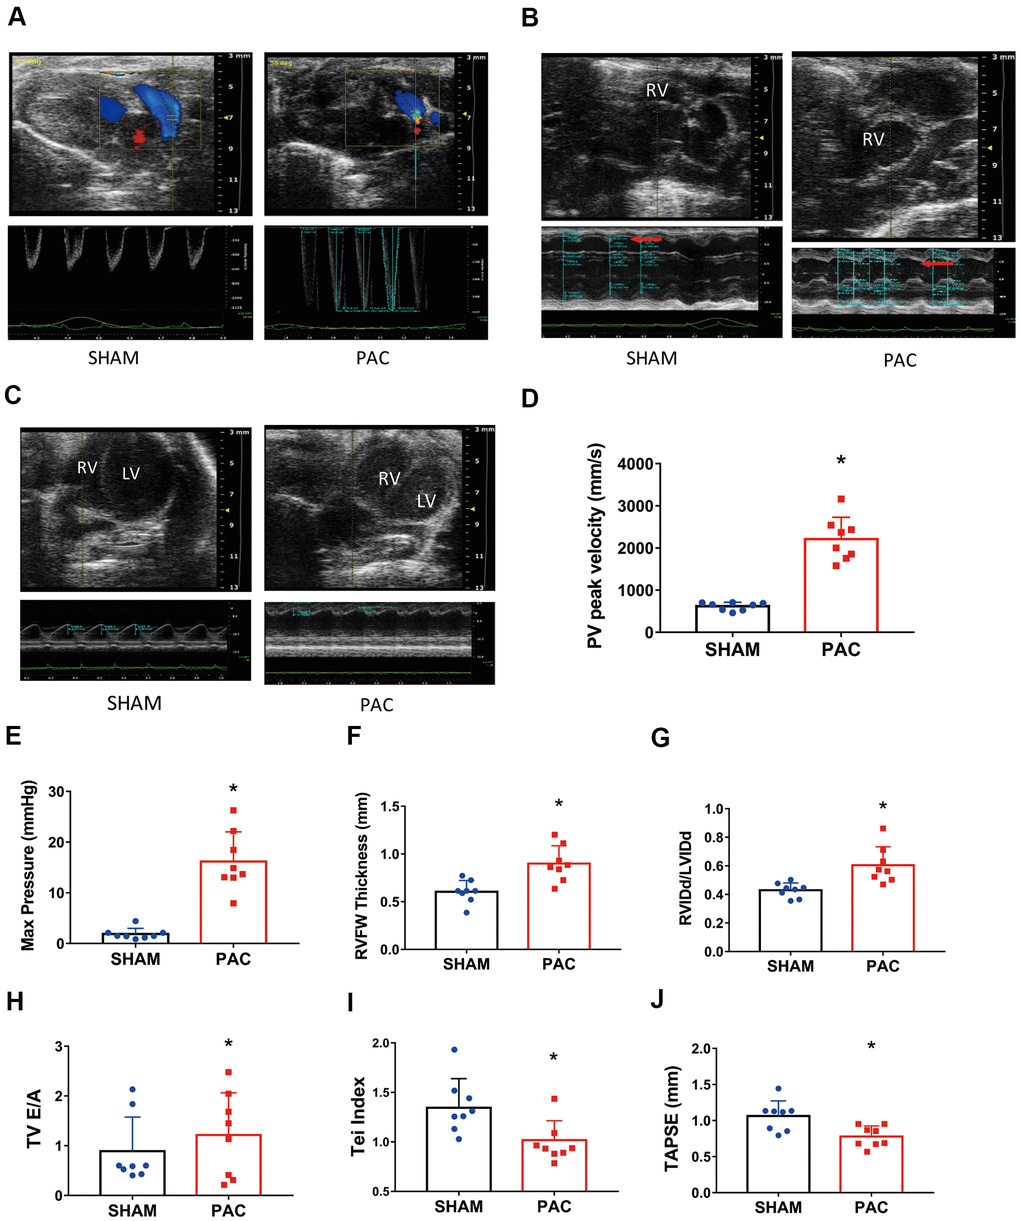
Figure 2.Pulmonary artery constriction induced right ventricular (RV) dysfunction. (A–C) Representative recordings of M-mode echocardiographic images; the red arrows point to the RV chamber. (D) The pulmonary valve (PV) peak velocity. (E) The pulmonary valve (PV) peak pressure. (F) The RV free wall thickness. (G) The ratio of right ventricular diastolic internal diameter to left ventricular diastolic internal diameter (RVIDd/LVIDd). (H) The tricuspid valve (TV) E/A ratio. (I) The RV myocardial performance index (or Tei index). (J) Tricuspid annular plane systolic excursion (TAPSE) in the sham and PAC groups. PAC: Pulmonary artery constriction. *P < 0.05 vs the corresponding sham group.