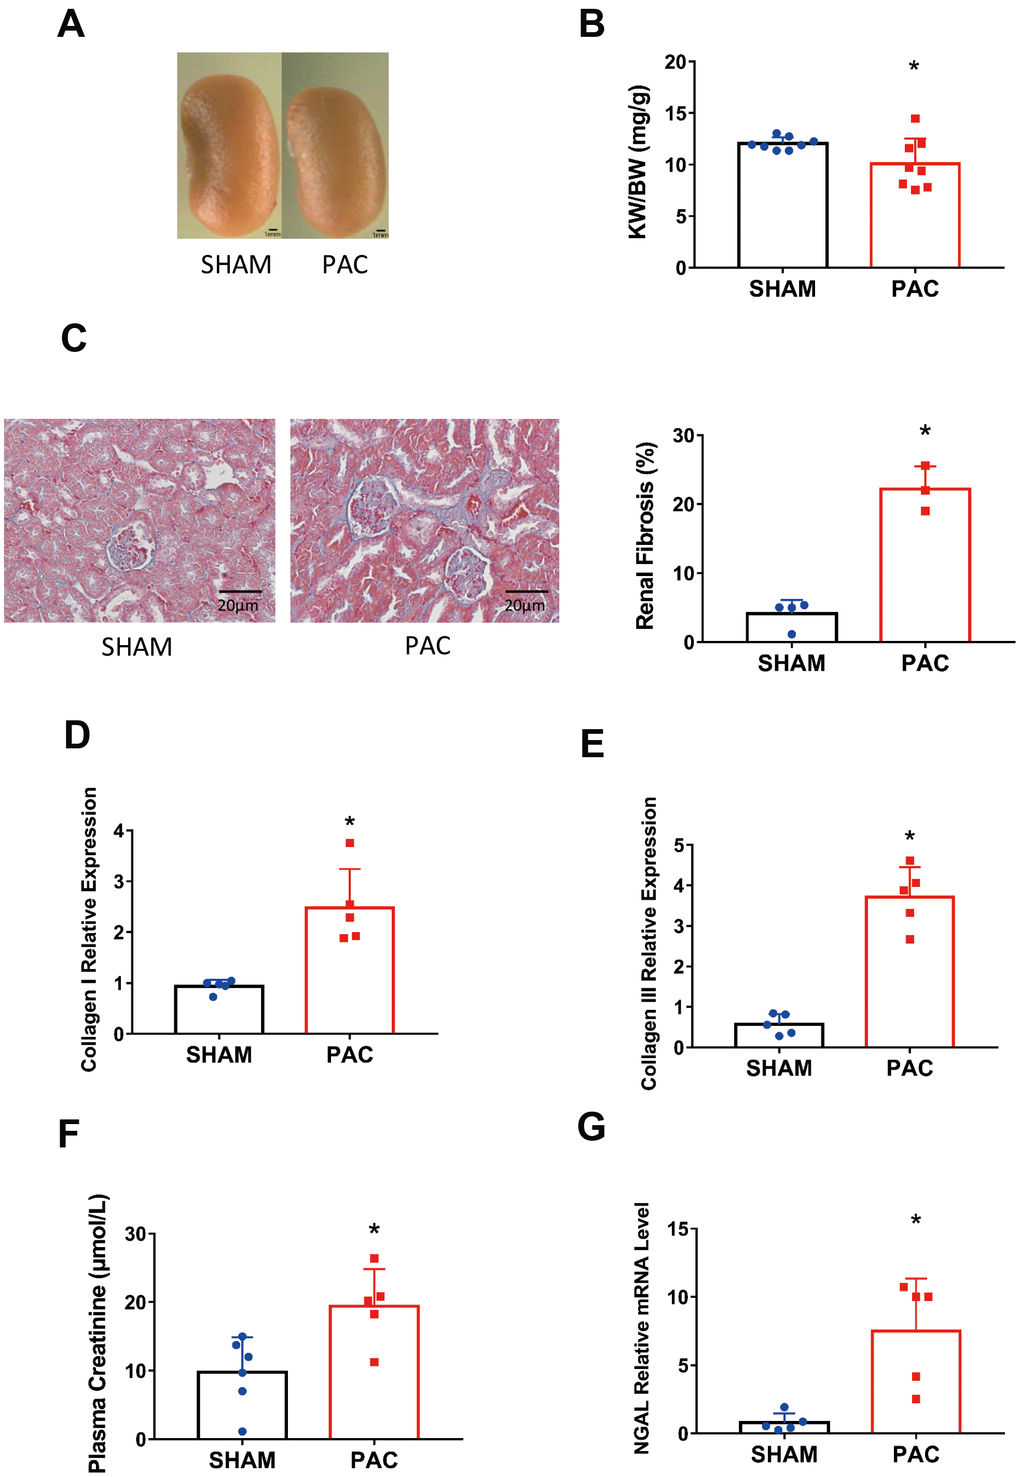
Figure 3.Pulmonary artery constriction induced renal dysfunction. (A) Representative pictures of the kidney in the sham and PAC groups. (B) The kidney weight to body weight ratio (KW/BW). (C) HE staining of the section around the glomerulus and their corresponding fibrosis area percentage. (D, E) Gene expression level of collagen I and collagen III in the kidney. (F) Plasma creatinine concentration in the two groups. (G) Gene expression level of neutrophil gelatinase-associated lipocalin (NGAL). PAC: Pulmonary artery constriction. *P < 0.05 vs the corresponding sham group. Scale bar=1 mm for panel A and scale bar = 20 μm for panel C.