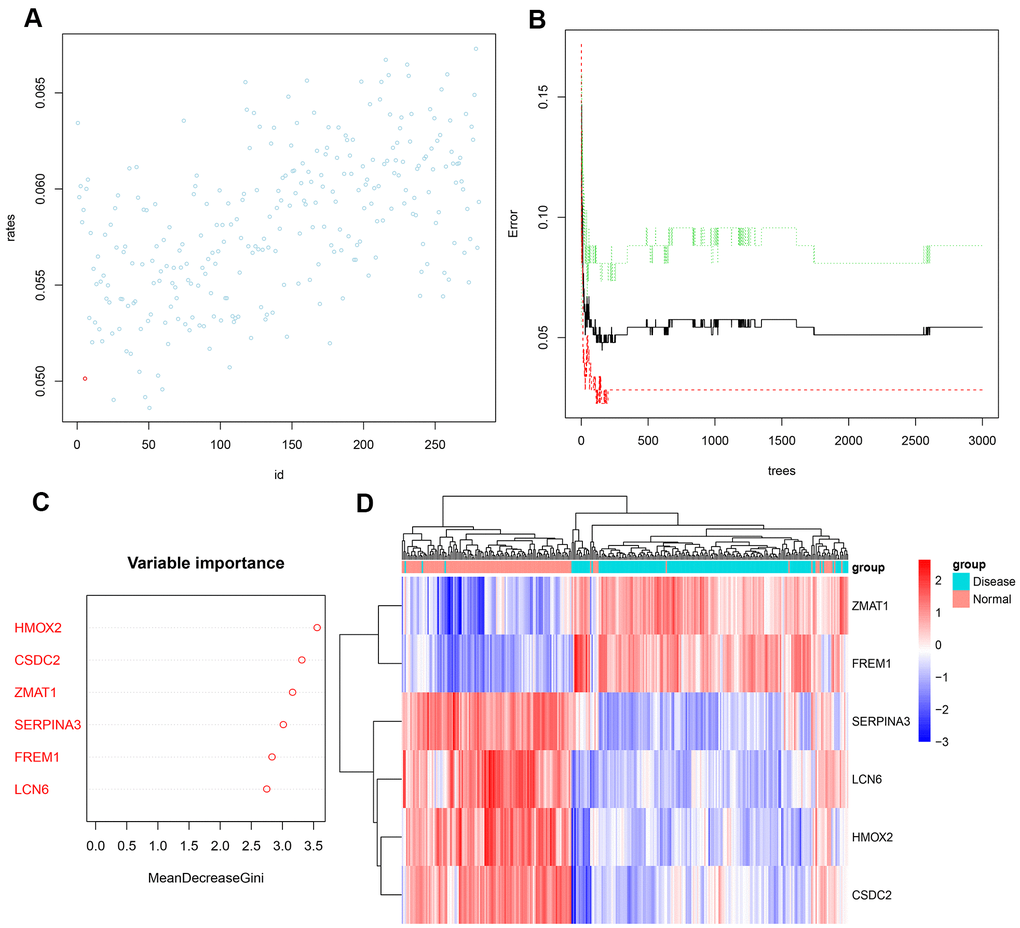
Figure 4.(A) Scatter plot of the effect of variable number selection on the average error rate. The x-axis represents the number of variables, and the y-axis indicates the out-of-band error rate. The point in the lower left represents the number of variables (i.e., six). (B) The influence of the number of decision trees on the error rate. The x-axis represents the number of decision trees, and the y-axis indicates the error rate. When the number of decision trees is approximately2000, the error rate is relatively stable. (C) Results of the Gini coefficient method in random forest classifier. The x-axis indicates the genetic variable, and the y-axis represents the importance index. (D) Heatmap of unsupervised clustering showing the results of the hierarchical clustering produced by the six important genes generated by random forest in GSE57345. Red color indicates genes with high expression in the samples, blue color indicates genes with low expression in the samples, the red band on the upper side of the heatmap indicates normal samples, and the blue band indicates HF disease samples.