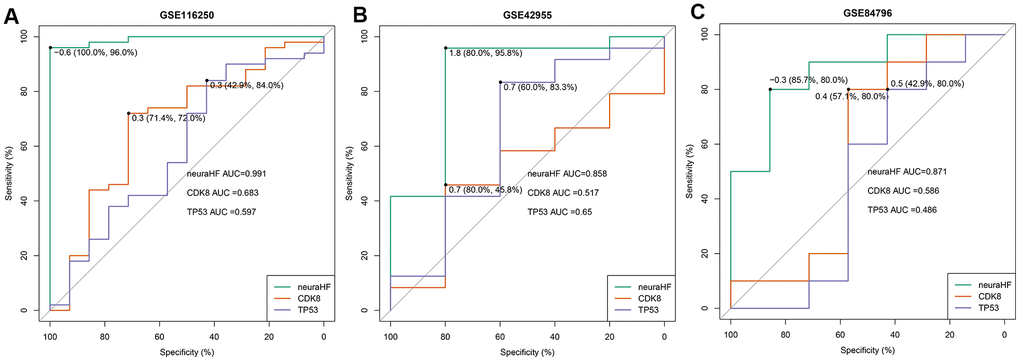
Figure 6.Plot showing AUC verification results. (A) AUC verification results in the GSE116250 dataset. (B) AUC verification results in the GSE42955 dataset. (C) AUC verification results in the GSE84796 dataset. The points marked on the ROC curve are the optimal threshold points, and the values in parentheses represent sensitivity and specificity. The AUC value is the area under the ROC curve.