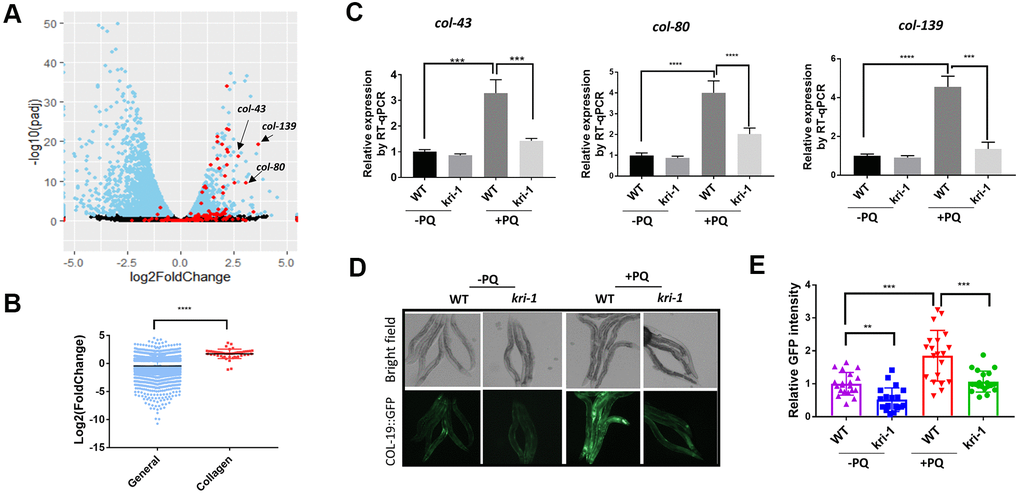
Figure 1.Paraquat increases collagen gene transcription in a KRI-1 dependent manner. (A) A Volcano Plot showing collagen transcripts were preferentially upregulated after paraquat treatment in C. elegans. Dataset GSE123531 was downloaded from NCBI and analyzed by Rstudio. Black indicates transcripts without significantly changed, blue significantly changed and red indicates collagen transcripts. Arrows point to top-ranked transcripts selected for further study. (B) Comparison of the average of log2 fold change of collagen genes versus that of all genes (General) significantly changed by paraquat. Error bars indicate the standard deviation. P values were obtained by two tailed, unpaired student’s t-test (****P<0.0001). (C) Collagen genes were upregulated by paraquat in a KRI-1-dependent manner. Wild-type (WT) and kri-1(ok1251) mutant C. elegans were treated with 75 μM paraquat (PQ) from L1 to day-1 of adulthood and total RNA was prepared for RT-qPCR analysis. Shown are the relative expression of col-43, col-80 and col-139 normalized to non-treated WT control. Error bars indicate the standard deviation of 3 experiments. P values were obtained by two tailed, paired student’s t-test (***P<0.001, ****P<0.0001). (D) COL-19::GFP was increased by paraquat in a KRI-1-dependent manner. Wild-type (WT) and kri-1(ok1251) mutant C. elegans expressing COL-19::GFP fusion proteins were treated with 75 μM paraquat (PQ) from L1 to day-1 of adulthood. Animals were imaged with fluorescence microscope. Shown are representative images from 2 experiments. (E) Quantification of GFP intensity in individual worms. 20 worms were selected from 2 independent experiments and quantified through ImageJ software. Data were normalized to the average of WT non-treated control. Error bars indicates the standard deviation of 20 worms. P values were obtained by two tailed, unpaired student’s t-test (**P<0.01, ***P<0.001).