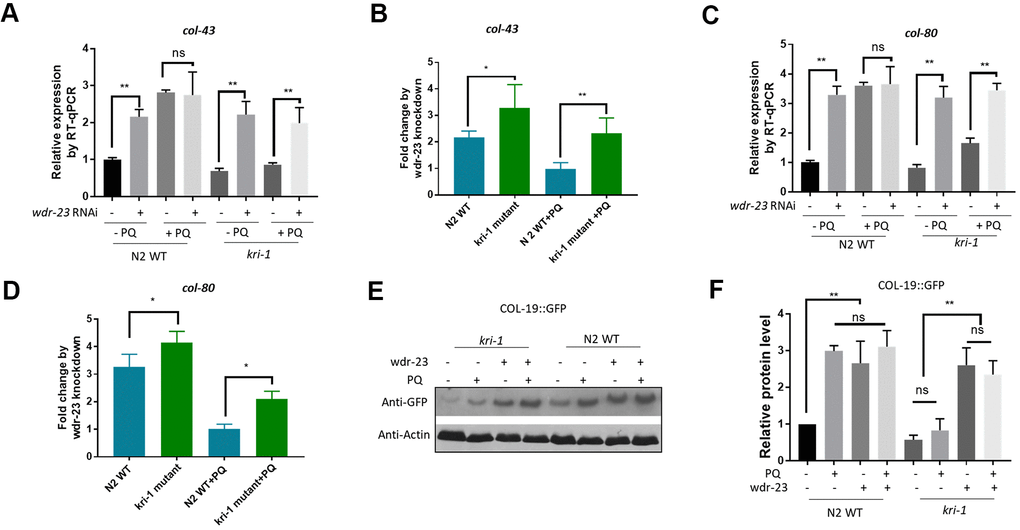
Figure 3.Hyperactivation of SKN-1 increases collagen gene transcription preferentially in kri-1 mutant worms. (A) Hyperactivation of SKN-1 by WDR-23 knockdown up-regulated col-43 transcription. WT C. elegans were fed control RNAi or wdr-23 RNAi bacteria on agar plate containing 75 μM paraquat (PQ) from L1 to day-1 of adulthood and total RNA was prepared for RT-qPCR analysis. Error bars indicate the standard deviation of 3 experiments. P values were obtained by two tailed, paired student’s t-test (**P<0.01, ns, not significant). (B) SKN-1 hyperactivation up-regulated col-43 expression preferentially in kri-1 mutant. Data from (A) were shown in fold changes by wdr-23 RNAi knockdown. P values were obtained by two tailed, paired student’s t-test (*P<0.05; **P<0.01). (C) wdr-23 knockdown up-regulated the transcription of collagen gene col-80. Experiments were conducted as in (A) except col-80 mRNA levels were examined. P values were obtained by two tailed, paired student’s t-test (** <0.01, ns, not significant). (D) wdr-23 knockdown up-regulated col-80 transcription preferentially in kri-1 mutant. Data in (C) were shown in fold change by wdr-23 RNAi knockdown. P values were obtained by two tailed, paired student’s t-test (*P<0.05). (E) wdr-23 knockdown partially rescued the collagen transcription defect in kri-1 mutant. C. elegans WT and kri-1 mutant expressing COL-19::GFP were fed control RNAi or wdr-23 RNAi bacteria on agar plate containing 75 μM paraquat (PQ) from L1 to day-1 of adulthood and the total proteins were prepared for Western blot analysis. Actin serves as a loading control. (F) Quantification of 3 biological replicates of Western blot data as shown in (E). Signals on each blot were quantified with ImageJ and normalized to non-treated WT controls. Error bars indicate the standard deviation of 3 biological repeats. P values were obtained by two tailed, paired student’s t-test (**P<0.01, ns, not significant).