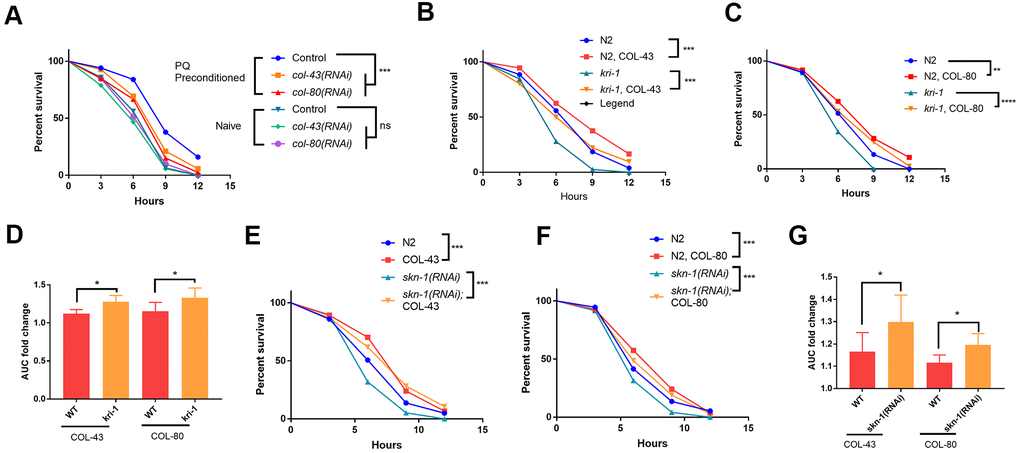
Figure 4.Collagen up-regulation by SKN-1 is required for protection from paraquat toxicity. (A) Low paraquat (PQ) preconditioning increased the tolerance to high PQ toxicity in a collagen-dependent manner. WT C. elegans were fed control RNAi, col-43 or col-80 RNAi bacteria on agar plate containing 75 μM paraquat (PQ) from L1 to day-1 of adulthood. Animals (n>100 each for 3 experiments) were transferred to agar plate containing 200 mM paraquat and examined every 3 hours for 12 hours. Survival data were statistically analyzed by log-rank test (ns, not significant, ****P<0.0001). (B, C) Collagen COL-43 and COL-80 overexpression increased the tolerance to paraquat toxicity in both WT and kri-1 mutant worms. Young adult worms (n>100 each for 3 experiments) expressing collagen COL-43 and COL-80 were subjected to paraquat toxicity assay as shown in (A). Survival data were statistically analyzed by log-rank test (***P<0.001). (D) Collagen COL-43 and COL-80 overexpression preferentially increased the tolerance to paraquat toxicity in kri-1 mutant worms. Area under the curve (AUC) in (B) and (C) was shown for 3 biological replicates and the fold changes were statistically analyzed by using paired student’s t-test (*P<0.05). (E, F) Collagen COL-43 and COL-80 overexpression increased the tolerance to paraquat toxicity in both WT and skn-1(RNAi) worms. WT worms (n>100 each for 3 experiments) expressing collagen COL-43 or COL-80 were fed skn-1 RNAi bacteria from L1 stage to young adult stage and subjected to paraquat toxicity assay as shown in (A). Survival data were statistically analyzed by log-rank test (***P<0.001). (G) Collagen COL-43 and COL-80 overexpression increased the tolerance to paraquat toxicity preferentially in skn-1(RNAi) worms. Area under the curve (AUC) in (E) and (F) was shown for 3 biological replicates and the fold changes were statistically analyzed by using paired student’s t-test (*P<0.05).