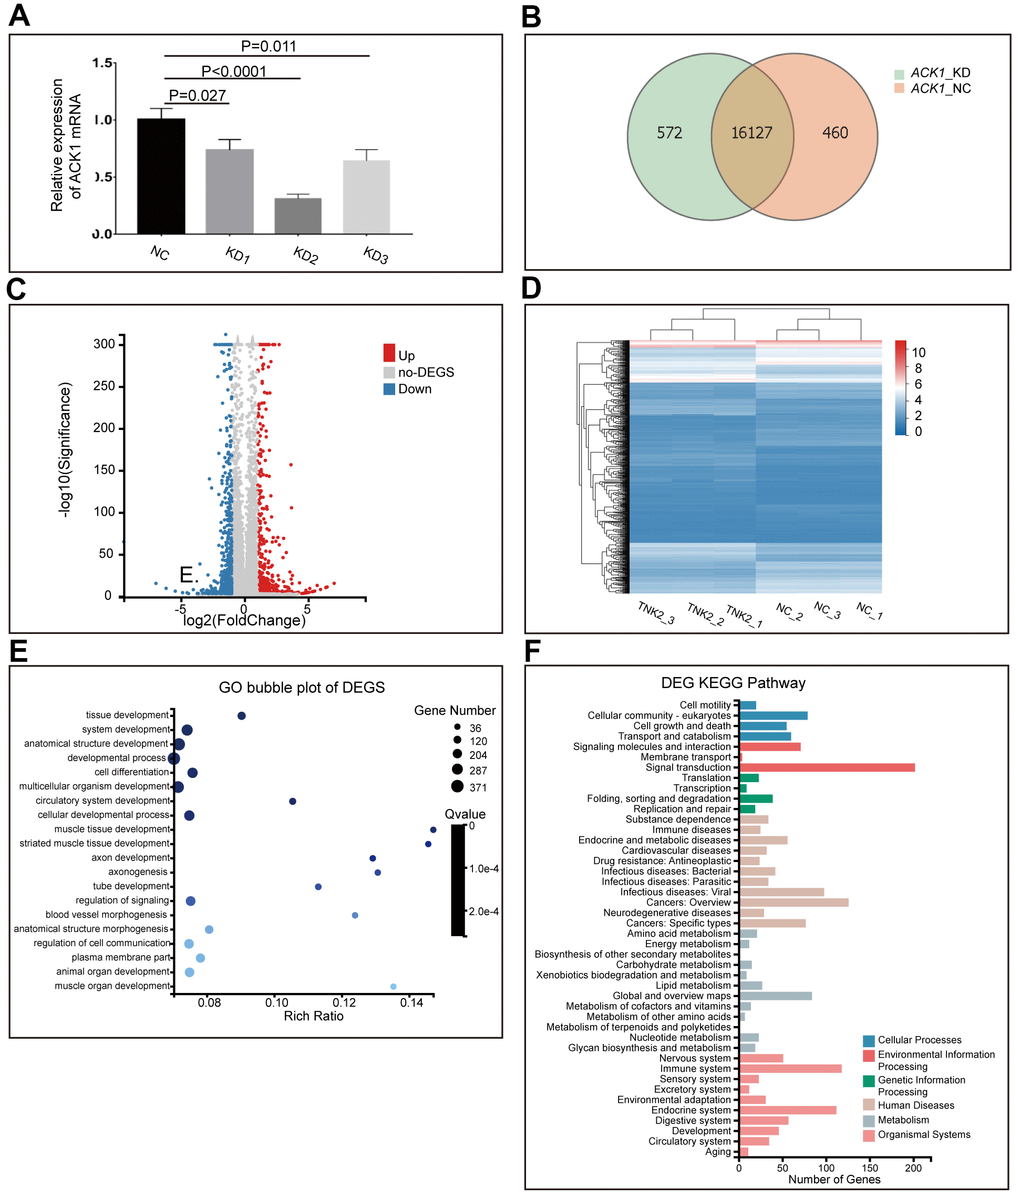
Figure 3.Knockdown (KD) of ACK1/TNK2 in A549 cells, followed by RNA-seq. ACK1 was silenced using three lentivirus-mediated shRNAs (A). The shRNA showing the highest efficiency of the ACK1 gene knockdown was used for subsequent experiments. Overlapping genes were identified in the negative control (NC) and KD groups (B). The volcano plot (C) indicated the significantly up- and downregulated genes after the silencing of ACK1 [absolute value of log2 (fold change) ≥1, P<0.001]. Based on differentially expressed genes (DEGs), three NC and three KD samples (shACK1/TNK2) were well clustered (D). Gene Ontology enrichment analysis of DEGs (E). KEGG pathway annotation of DEGs (F).