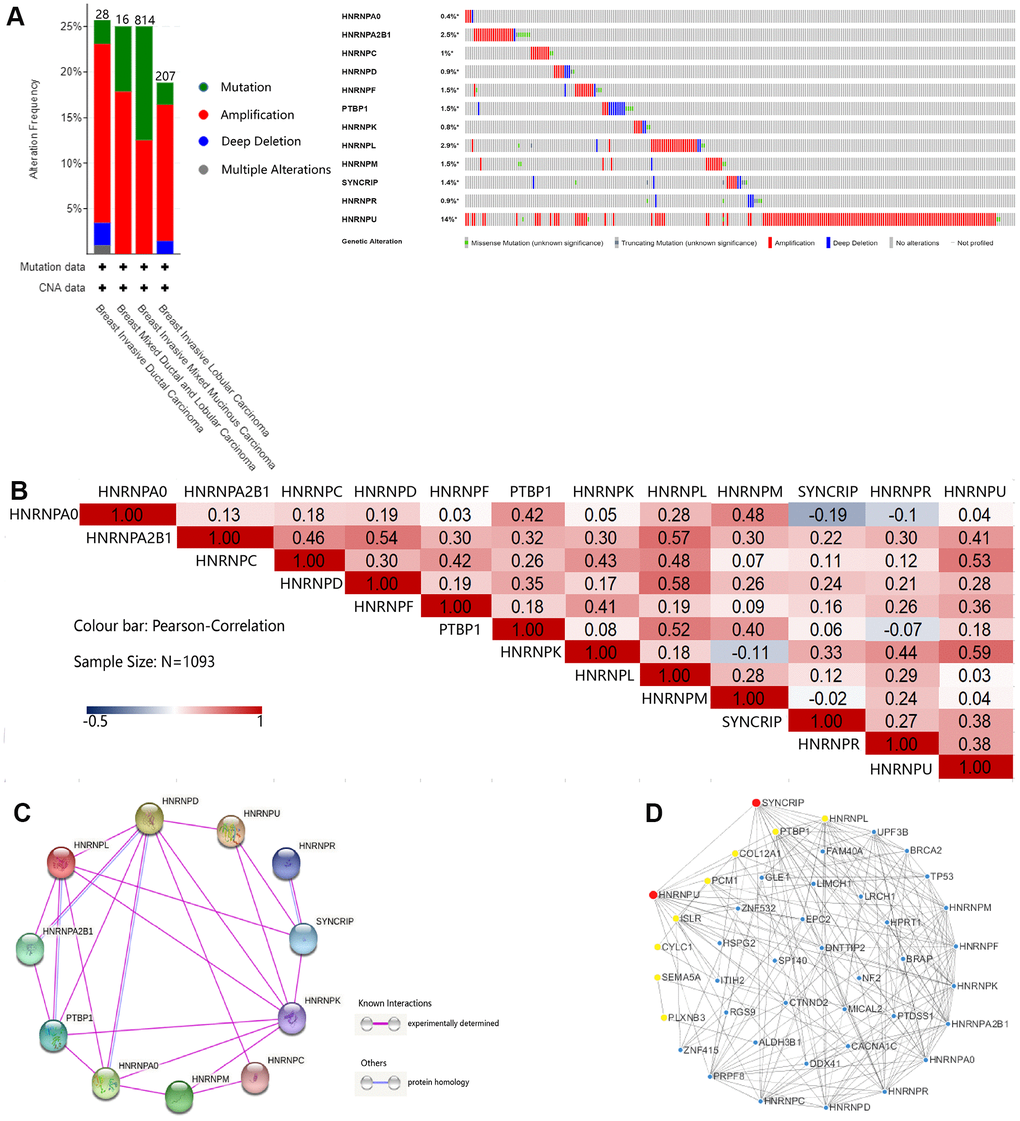
Figure 5.Genetic mutation, interaction, and coexpression analyses of hnRNPs in patients with BRCA. (A) Summary of the alteration frequencies of nodal metastasis-related hnRNPs in patients with TCGA-BRCA (Breast Invasive Carcinoma, TCGA). The number of patients for each BRCA subtype is indicated at the top of each column and each type of alteration, including deletions (blue), amplification (red), multiple alterations (gray), or mutations (green), is shown using the cBioPortal. (B) Correlation plot based on Spearman’s correlation test results to show the correlation of gene expression among the 12 hnRNP family members in BRCA. (C) PPI among hnRNPs was derived from STRING. The purple connection indicates the protein interaction determined by the experiment and the blue connection indicates that the proteins are homologous. (D) The 12 hnRNP family members and coexpressed gene networks were screened using Cytoscape. Red and yellow represent the top 10 hub genes.