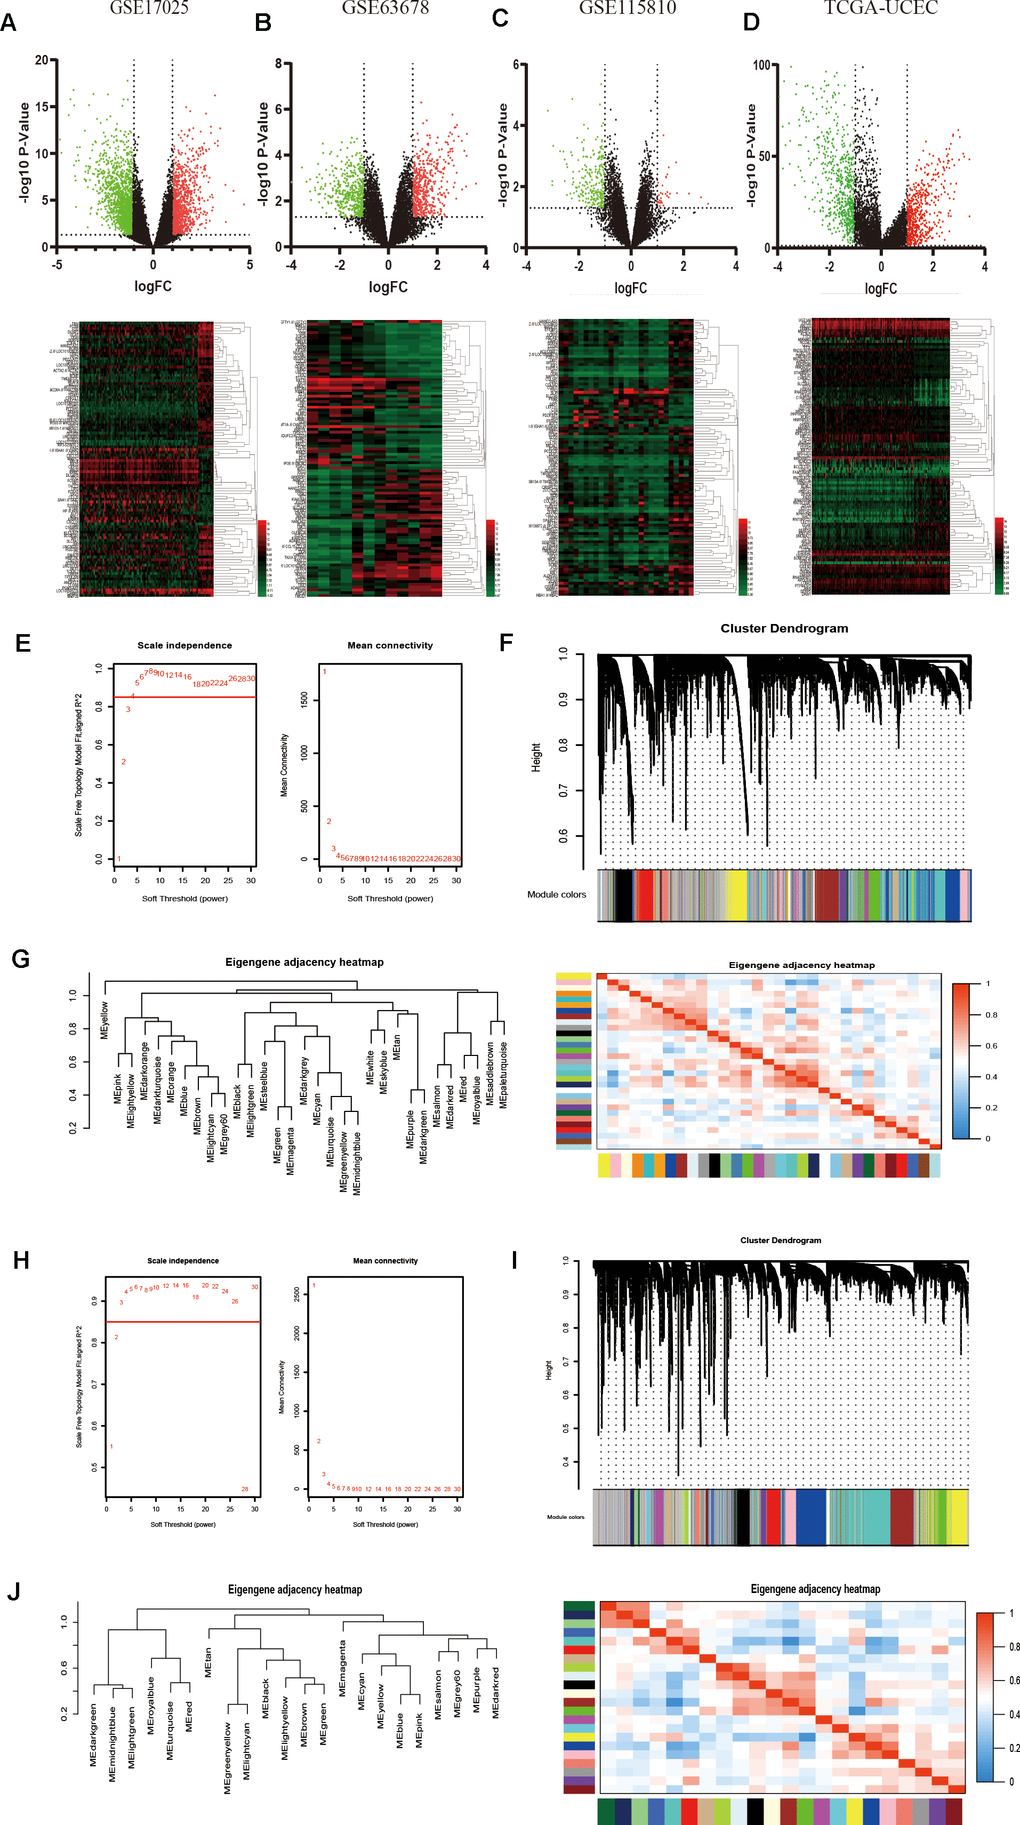
Figure 1.Identification of DEGs among GEO and TCGA-UCEC datasets and construction of co-expression modules by WGCNA package. (A–D) The volcano plots and heatmaps of DEGs in GSE17025, GSE63678, GSE115810 and TCGA-UCEC databases, respectively. In the heatmap, red indicates relative upregulation of gene expression; black indicates no significant change; green indicates downregulation of gene expression. (E) Analysis of the scale-free fit index and mean connectivity for various soft-thresholding powers for TCGA samples. (F) Dendrogram of differentially genes clustered based on a dissimilarity measure (1-TOM) for TCGA samples. (G) Dendrogram of consensus module eigengenes and heatmap of the adjacencies for TCGA. (H) Analysis of network topology for various soft-threshold powers for GSE17025 data. (I) Clustering dendrogram of genes in GSE17025 with dissimilarity based on topological overlap, together with assigned module colors. (J) Visualizing the gene network using a heatmap plot of GSE17025 data.