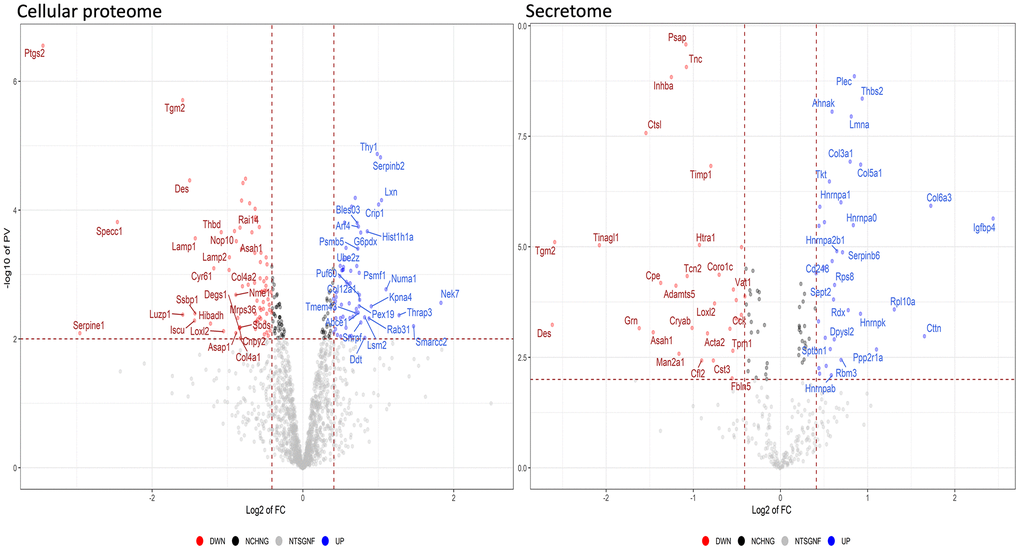
Figure 5.Quantitative changes in the protein expression of MSCs following HFD treatment. The volcano plot displays the results of up- and down-regulated proteins in HFD samples compared to ND samples. Panels data from cellular proteome and secretome, respectively.