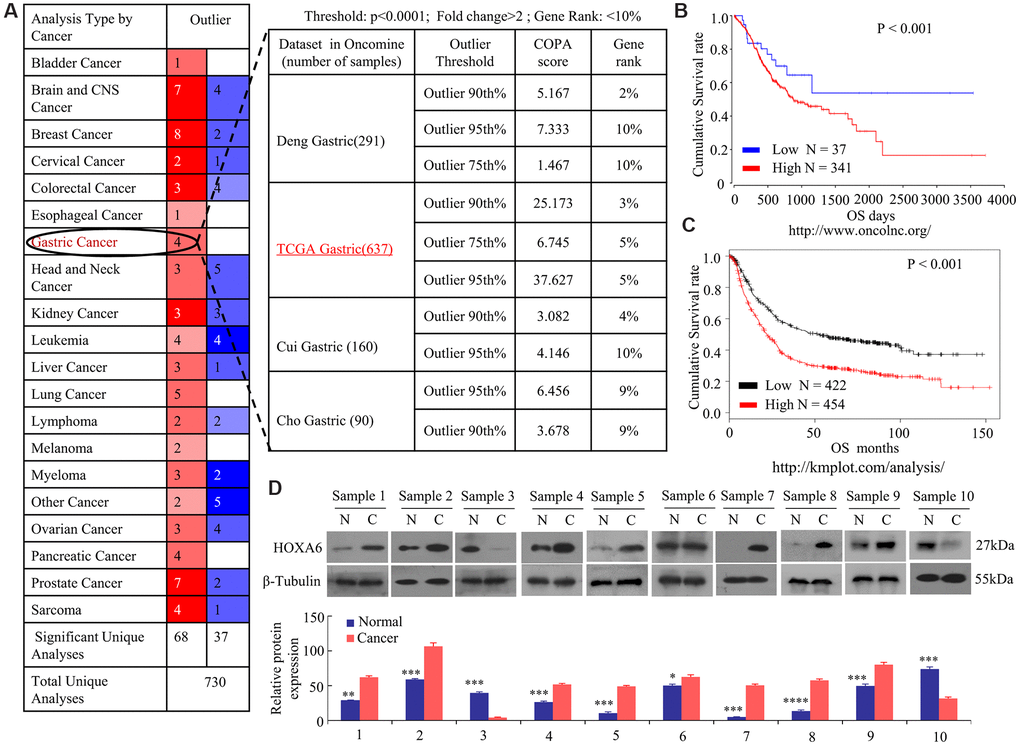
Figure 1.Increased levels of HOXA6 in GC data sets from public databases and human GC tissue. (A) Analysis of four Oncomine datasets showed that the mRNA expression levels of HOXA6 in GC are significantly higher than in normal tissues. The numbers in the red boxes in the Outlier panel in the table denote the number of data sets. (B, C) Kaplan-Meier plots from data on the OS of patient cohorts from the OncoLnc (B) and Plotter (C) databases. N = number; OS, overall survival. (D) The relative HOXA6 protein expression levels in 10 pairs of GC tissues (C) and matched adjacent non-tumorous tissues (N). b-Tubulin expression was measured and served as the loading control. The grey level of each band quantified. The protein expression relative levels were compared with Quantity One software. *, P > 0.05; **, P < 0.05; ***, P < 0.01; ****, P < 0.001.