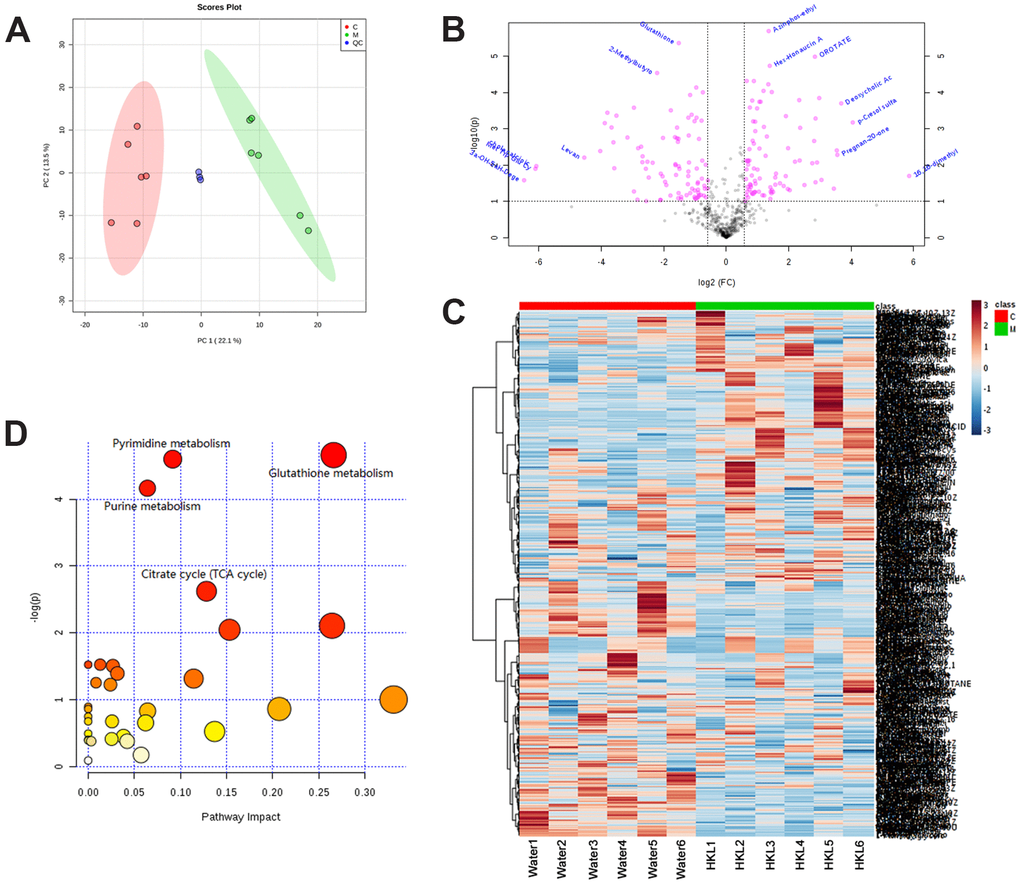
Figure 7.Identification of differentially expressed metabolites. (A) Principal Component Analysis examines the distribution of samples. (B) The log2 ratio of fold change and –log(P-values) plotted in the form of volcano plots. Red dots represent differentially expressed metabolites and black dots represent non-significantly changed metabolites. (C) Heatmap illustrates the metabolite profile. The column represents sample and the row represents relative molecular mass. (D) The bubble graph represents the significantly enriched pathways of DEGs. UC rats were treated with water or HKL for 7 days and fetal samples were collected for metabolomics assay. LC-MS/MS analyses were performed on 6 rats from water or HKL treated groups. Each bubble represents one individual pathway. The area of the bubble positively correlates with the importance in pathway. C, M, QC, quality control samples.