Submit an Article
Navigate
Home
Editorial Board
Editorial Policies
Current Volume
Archive
Scientific Integrity
Publication Ethics Statements
Interviews with Outstanding Authors
Newsroom
Sponsored Conferences
Podcast
Contact
Special Collections
Submit an Article
Online ISSN: 1945-4589
Research Paper
|
Volume 13, Issue 4
|
pp. 5120–5135
Identification of hub genes and key pathways in the emphysema phenotype of COPD
Back to article
Figure 7
(7 of 7)
−
100%
+
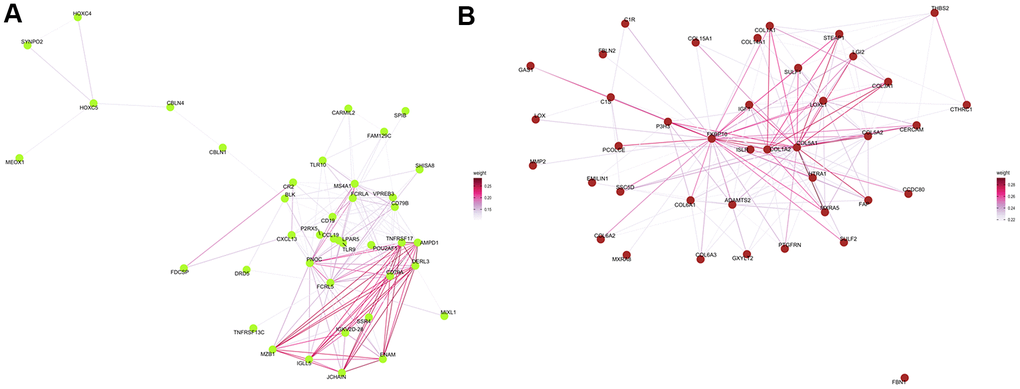
Figure 7.
Protein–protein interaction network analysis.
Visualization of the network connections among the most highly connected genes within the green-yellow (
A
) and brown (
B
) modules. Edge weights represent similarity between nodes.