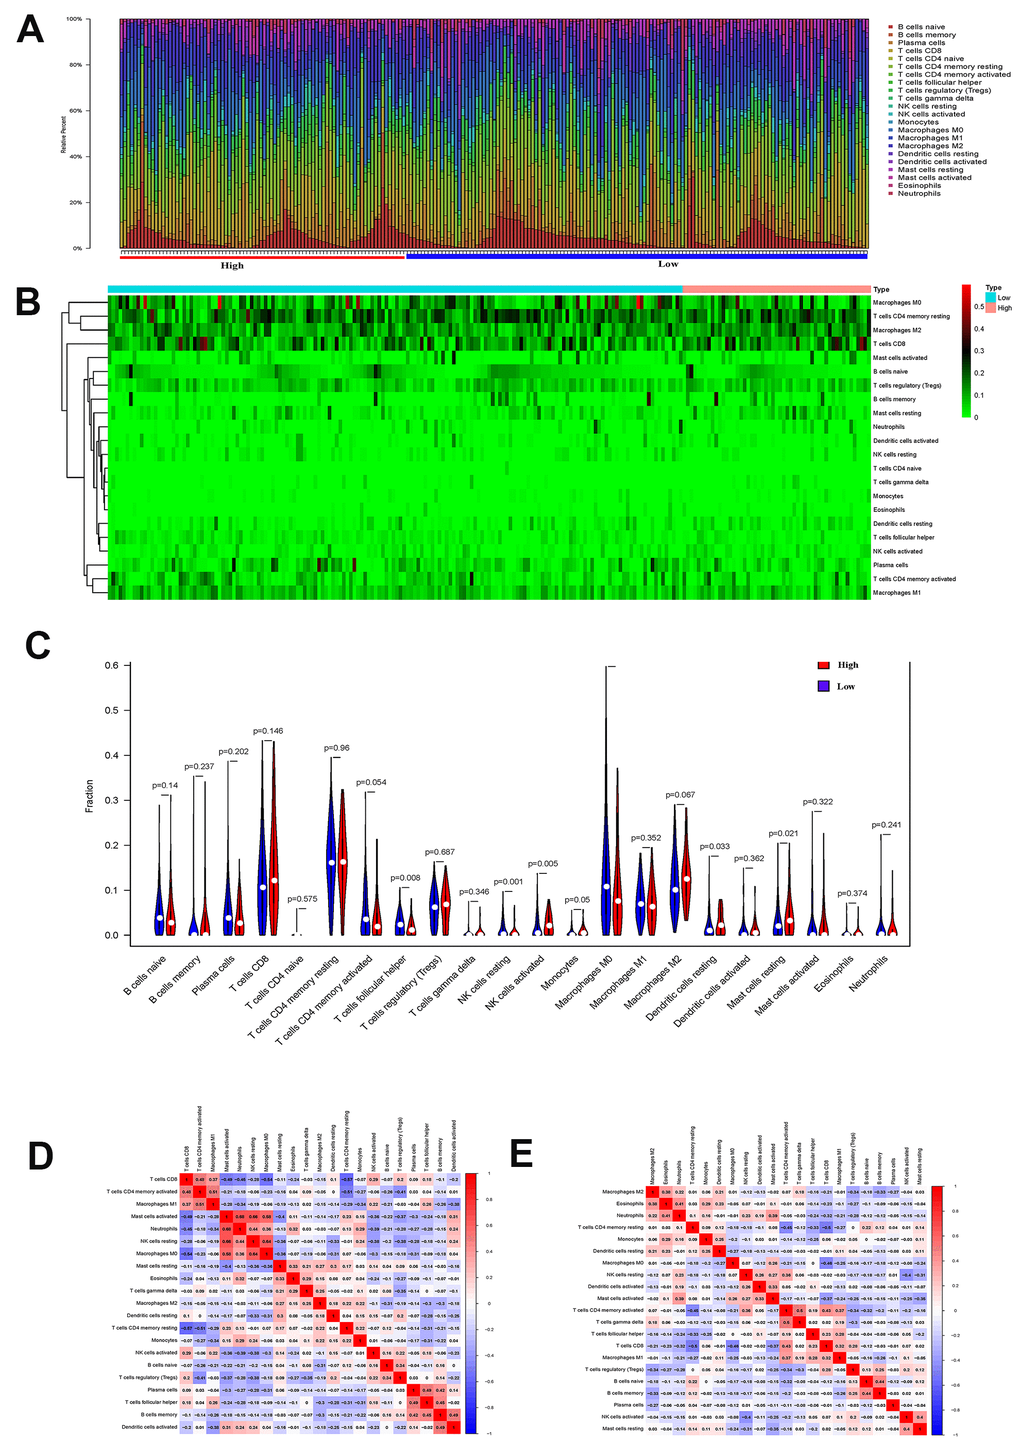
Figure 2.(A) The proportion of immune cell subsets in the EMT group and Non-EMT group. (B) Heat map of different immune cell subsets in EMT group and Non-EMT group. (C) The violin plot of the statistical differences between the tumor cells of different EMT groups. (D) The heat map of the correlation between tumor immune-infiltrating cells of EMT group. (E) Summary of the correlation between tumor immune-infiltrating cells of non-EMT group.