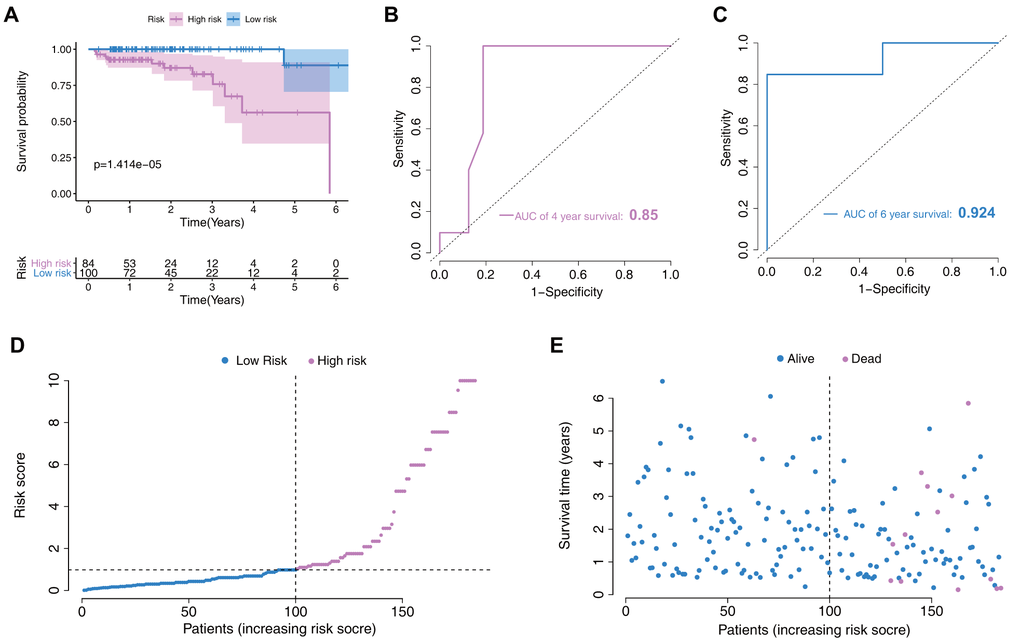
Figure 5.Nomogram verification in the validation set. (A) Kaplan–Meier survival analysis between the low- and high-risk groups. (B) Receiver operating characteristic (ROC) curves for 4-year prediction. (C) ROC curves for 6-year prediction. (D) Distribution of the risk scores in low- and high-risk groups. (E) Patient distribution in the low- and high-risk groups based on survival status.