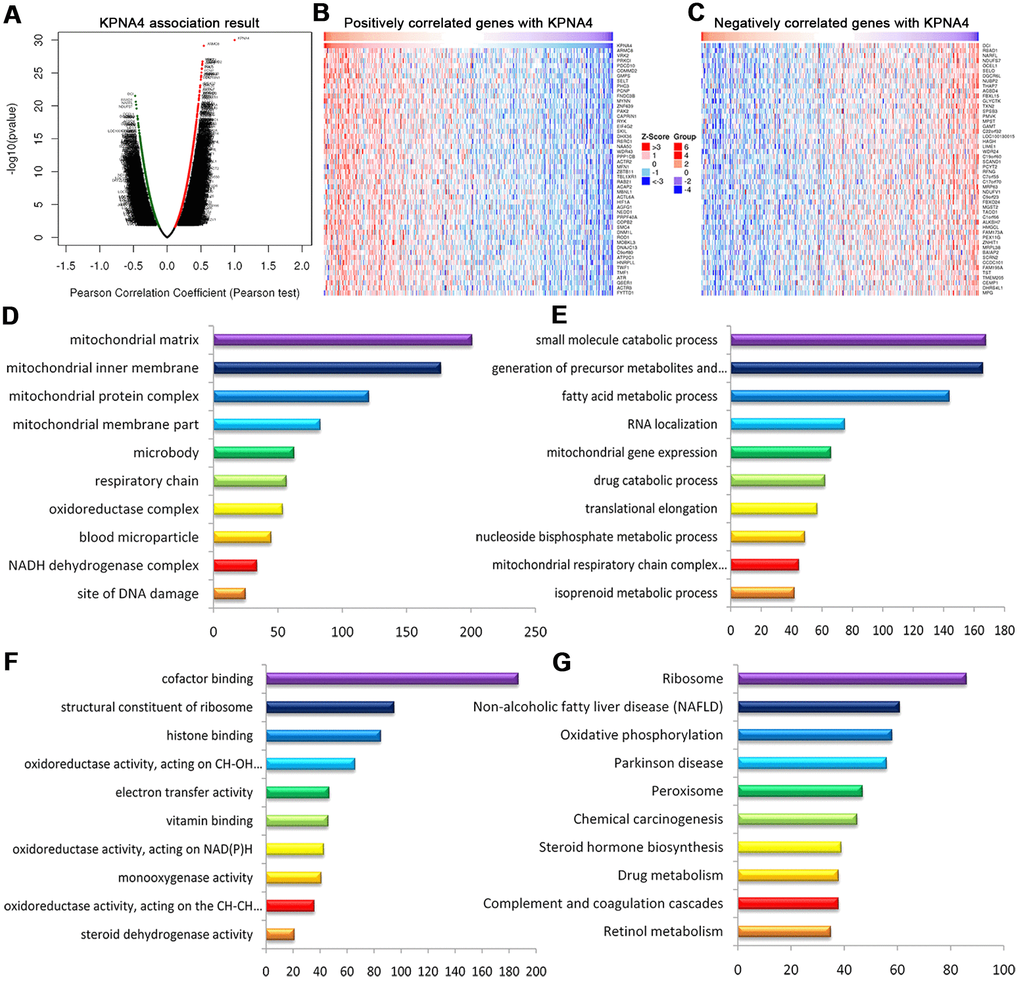
Figure 8.Genes differentially expressed in correlation with KPNA4 in HCC (LinkedOmics). (A) Volcano plot showing genes correlated with KPNA4 through Pearson’s test analysis. (B, C) Heat maps showing the top 50 genes positively and negatively correlated with KPNA4 in HCC; red (positive), green (negative). The significantly enriched GO annotations ((D) cellular components, (E) biological processes, (F) molecular functions) and KEGG pathways (G) of KPNA4 coexpressed genes were analyzed using GSEA.