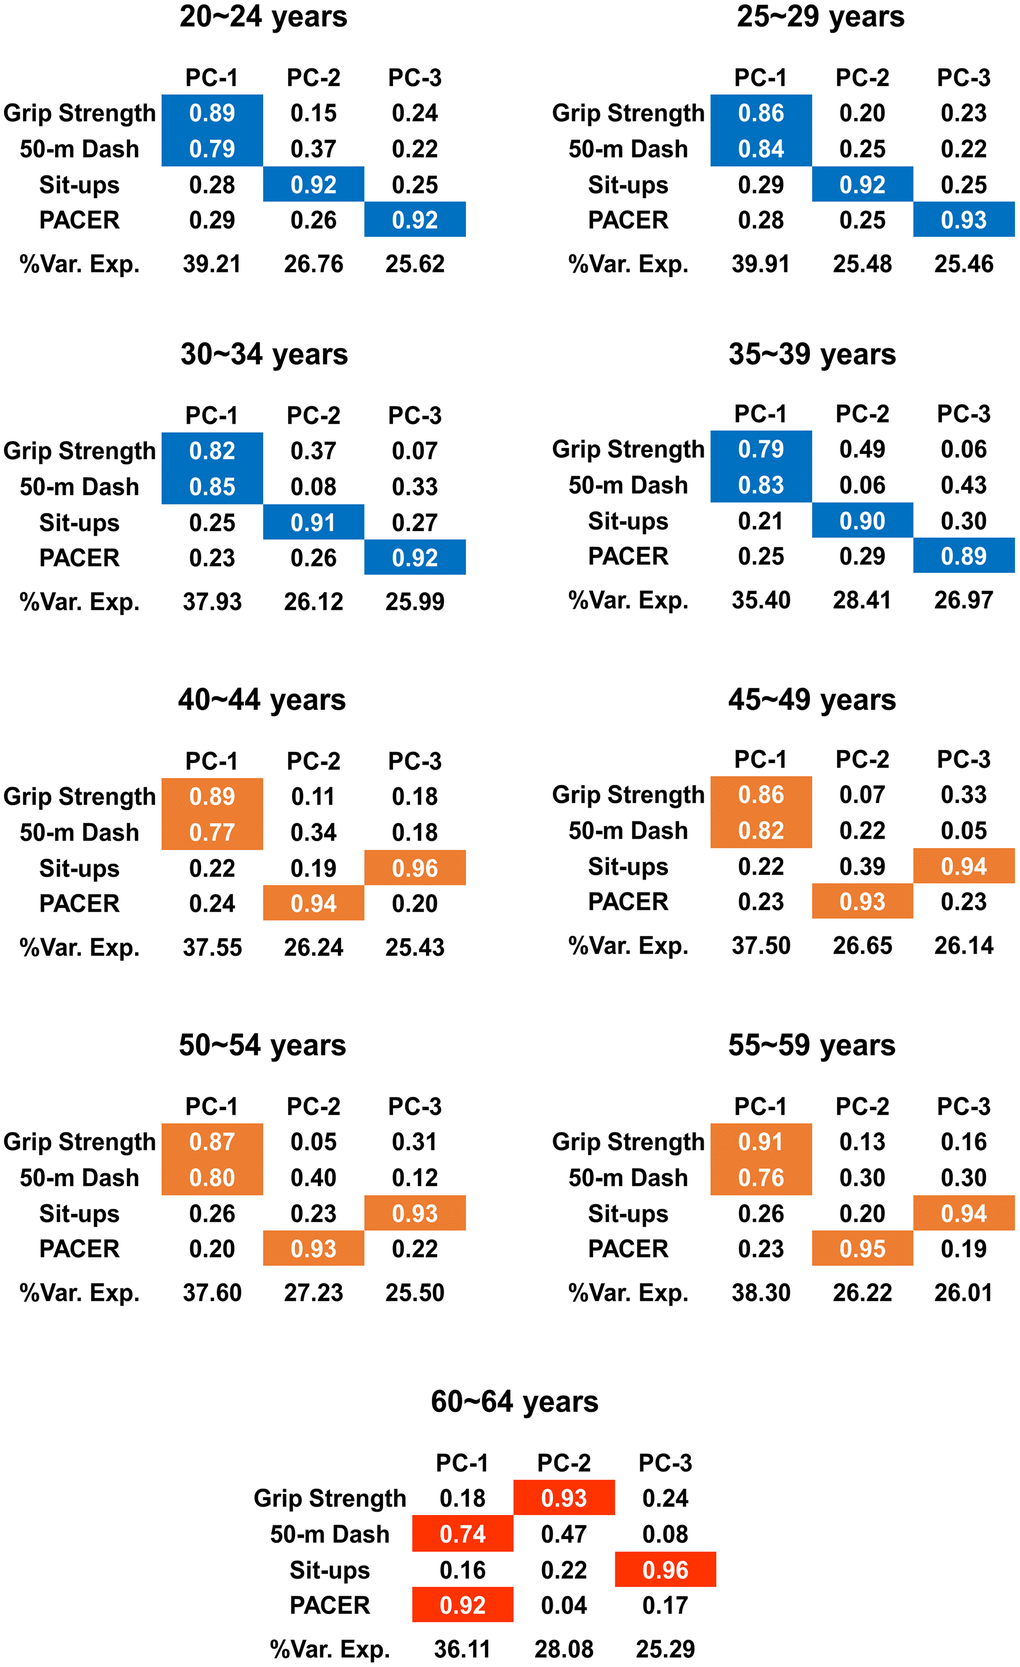
Figure 3.Changes in the loading patterns with increase in age. The results from PCA are summarized. Each of the first three PCs and the factor loadings of them are shown for each age group. %Var. Exp denotes the proportion of variance explained by each PC, and the colors are assigned only when the factor loadings are significant, i.e., when the factor loadings are greater than or equal to 0.5. The pattern of the significant factor loadings on the first three PCs changes due to age; the three different colors (blue, orange, and red) indicate three categories classified according to the loading pattern.