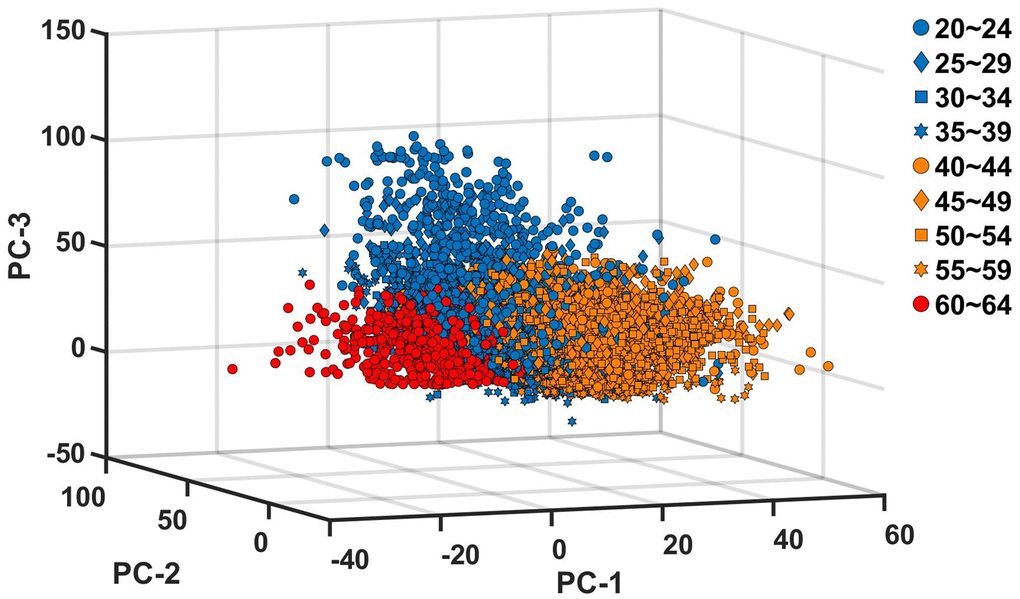
Figure 4.Projection of principal component scores into the principal component space. The PC scores are calculated for each of the nine age groups, and projected into the three dimensional space with the basis vectors of PC-1, PC-2 and PC-3 of each age group. The blue, orange and red colors indicate, PC scores of age groups between 20 and 39, PC scores of age groups between 40 and 59, and PC scores of age group 60~64, respectively.