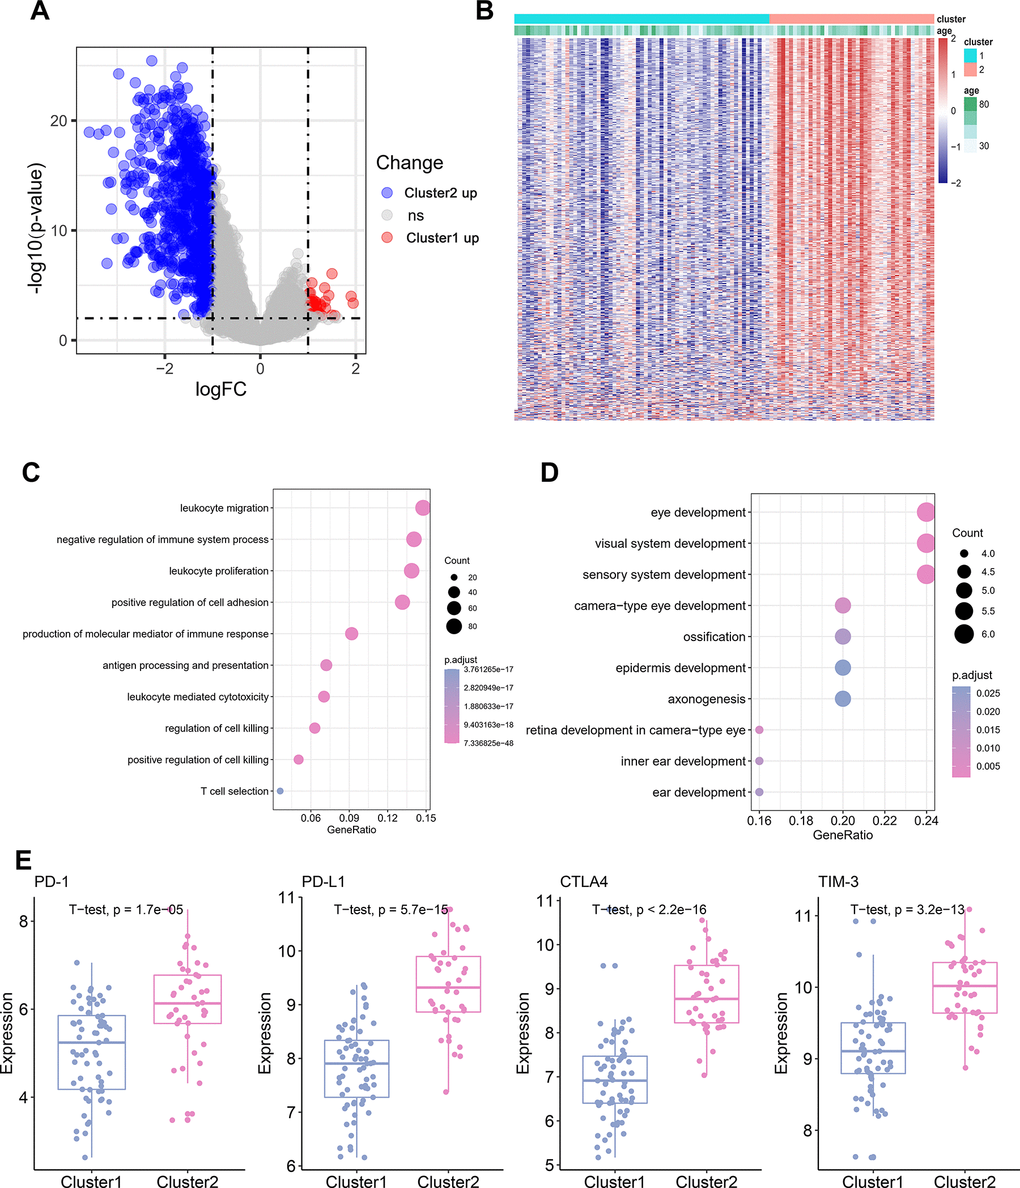
Figure 2.Differential gene and pathway Analysis of Different TME Cluster of TNBC. (A) The volcano plot showing the differentially expressed gene (DEGs) between TME Cluster 1 and Cluster 2. Blue is highly expressed in Cluster 2 and red is highly expressed in Cluster1. (B) Heatmap shows the expression of DEGs between the two clusters. (C) KEGG functional enrichment analyses of the up-regulated genes in Cluster 2. (D) KEGG functional enrichment analyses of the up-regulated genes in Cluster 1. (E) Expression of four immune checkpoint molecules genes in the two clusters.