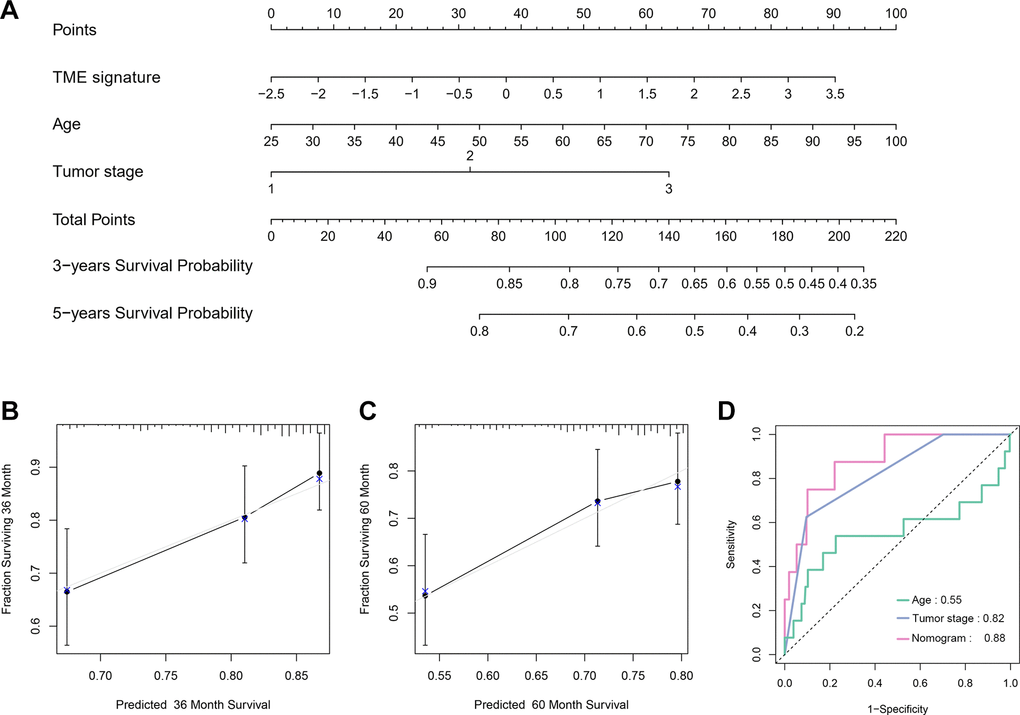
Figure 7.Nomogram construction and evaluation. (A) Nomogram for predicting 3- and 5-year survival probabilities of TNBC. Three points are allocated for age, tumor stage and TME signature. Draw a vertical straight line from the variable value to the axis labeled “Points”. Then calculate all variables’ points. The total points on the bottom scales that correspond to the 3- and 5-y survival were showed apparently. (B, C) Calibration curves for predicting 3-y (B) and 5-y (C) OS. Predicted survival produced by nomogram is plotted on the x-axis, and actual survival is plotted on the y-axis. Dashed lines represent an identical calibration model in which predicted OS approximate to actual OS. (D) Comparison of the predictive accuracy of nomogram, tumor stage and age.