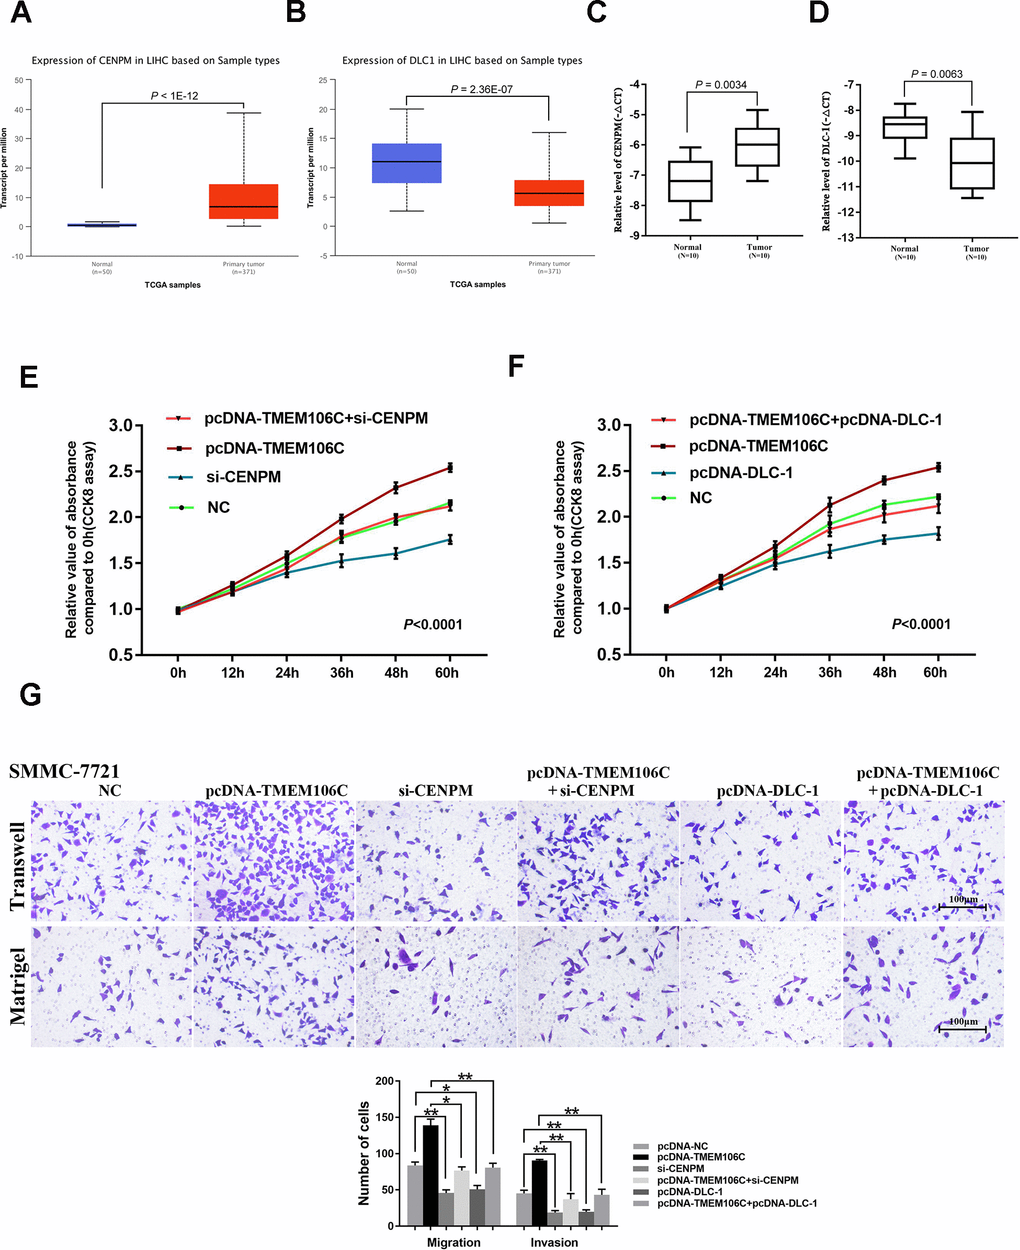
Figure 5.The verification of TMEM106C potentially related target genes in HCC. (A) Relative level of CENPM in normal liver and LIHC samples (UALCAN). (B) Relative level of DLC-1 in normal liver and LIHC samples (UALCAN). (C) Relative expression level of CENPM in 10 pairs of HCC samples (tumor tissues and adjacent normal liver tissues), as assessed by real-time PCR. (D) Relative expression level of DLC-1 in 10 pairs of HCC samples (tumor tissues and adjacent normal liver tissues), as assessed by real-time PCR. (E) si-CENPM (50 nM) and pcDNA-TMEM106C plasmid plus si-CENPM were transfected into SMMC-7721 cells. Every 12h, the cell number was measured by CCK8 assay. NC represents pcDNA3.1, si-NC, and blank control, which were proven to not be different from each other. 400×. P < 0.001. (F) pcDNA-TMEM06C and pcDNA-DLC-1 plus pcDNA-TMEM06C plasmid (or no plasmid control) were transfected into SMMC-7721 cells. Every 12 h, the cell number was measured using the CCK8 assay. NC represents pcDNA3.1 and the blank control, which was proven to not be different from each other. P < 0.001. (G) Transwell migration and invasion assays of SMMC-7721 cells after transient transfection with pcDNA-TMEM06C, si-CENPM, pcDNA-TMEM06C and si-CENPM, pcDNA-DLC-1 plus 34 pcDNA-TMEM06C plasmid (or no plasmid control). The migration and invasion cell numbers are shown in histograms (mean ± SD). NC represents pcDNA3.1, si-NC, and blank control, which were proven to not be different from each other. *P < 0.05, **P < 0.01.