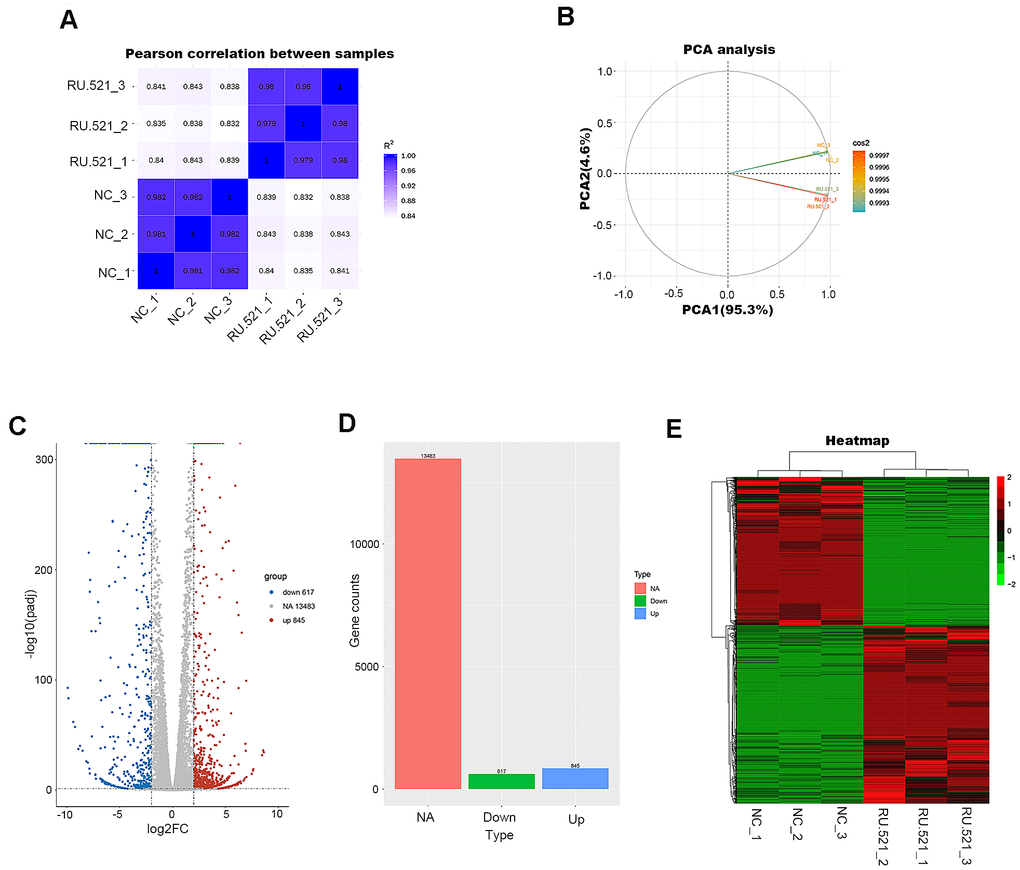
Figure 4.Transcriptome profiling of RU.521-treated RAW264.7 macrophages. (A) Pearson’s correlation analysis of samples. The color reflects the intensity of the correlation. The higher the correlation coefficient between samples, the closer the expression pattern. (B) PCA analysis of samples. Principal component 1 (PC1) and principal component 2 (PC2) are indicated on the X-axis and Y-axis, respectively. Cos2 stands for variables. The closer the two samples were to each other, the smaller the difference was between the two samples in terms of gene expression patterns. (C) Volcano plot of the DEGs. The X-axis represents the difference in log 2 conversion, the Y-axis represents the significant difference after log 10 conversion, the blue represents the down-regulated DEGs, the red represents the up-regulated DEGs, and the gray represents the non-DEGs. The DEGs were defined according to the criteria of log2FC ≥2 and Padj <0.005. (D) Bar graph showing DEGs. The X-axis represents the type, the Y-axis represents gene counts, the green represents the downregulated DEGs, the blue represents the upregulated DEGs, and the red is the non-DEGs. (E) Hierarchical clustering heatmap. Red and green represent high and low relative expression, respectively. Rows represent DEGs, and columns represent samples. DEGs, differentially-expressed genes; PCA, principal component analysis.