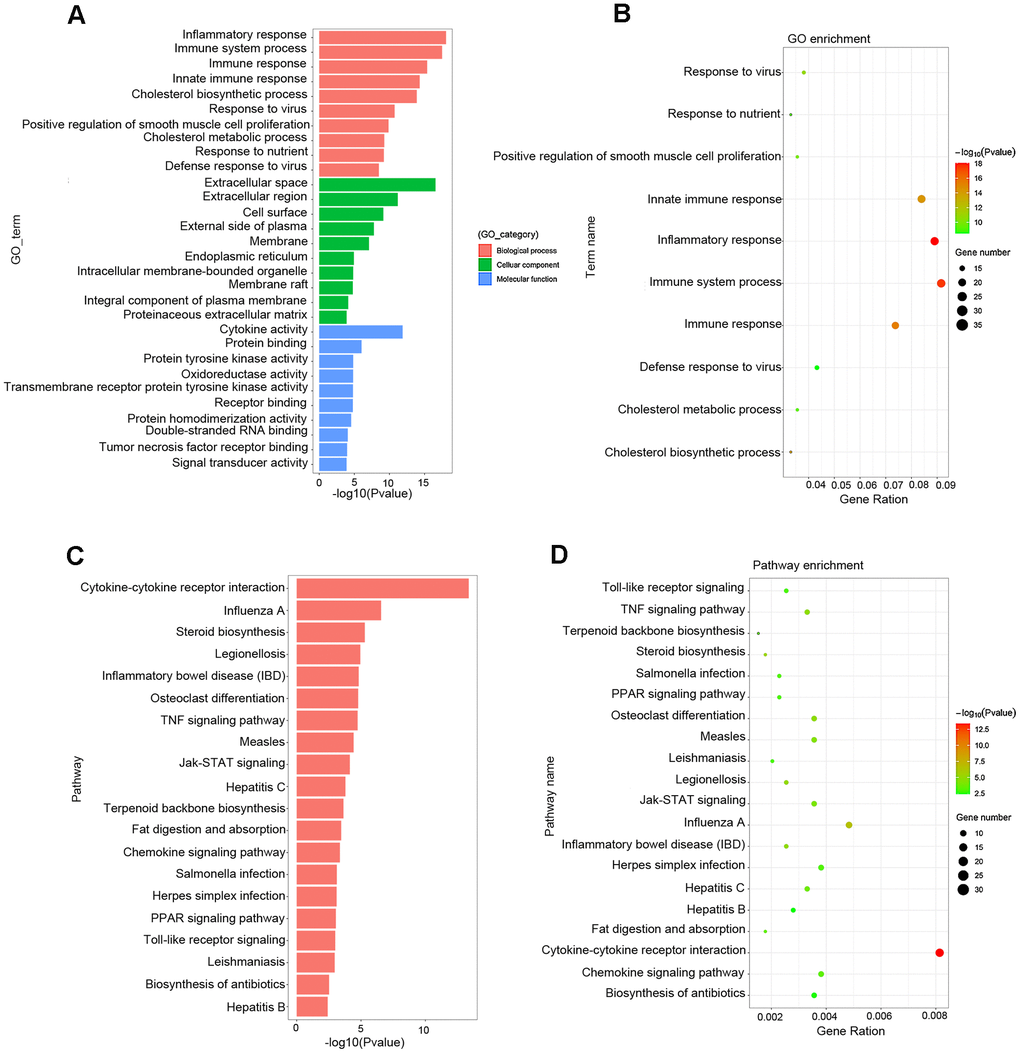
Figure 5.Functional enrichment analysis associated with atherosclerosis. (A, B) The GO function classification map and bubble chart of DEGs associated with atherosclerosis. (C, D) KEGG pathway classification map and bubble chart of DEGs. The X-axis represents the functional classification, and Y-axis represents the significant differences after the log 10 conversion or gene ratio. GO, Gene Ontology; KEGG, Kyoto Encyclopedia of Genes and Genomes.