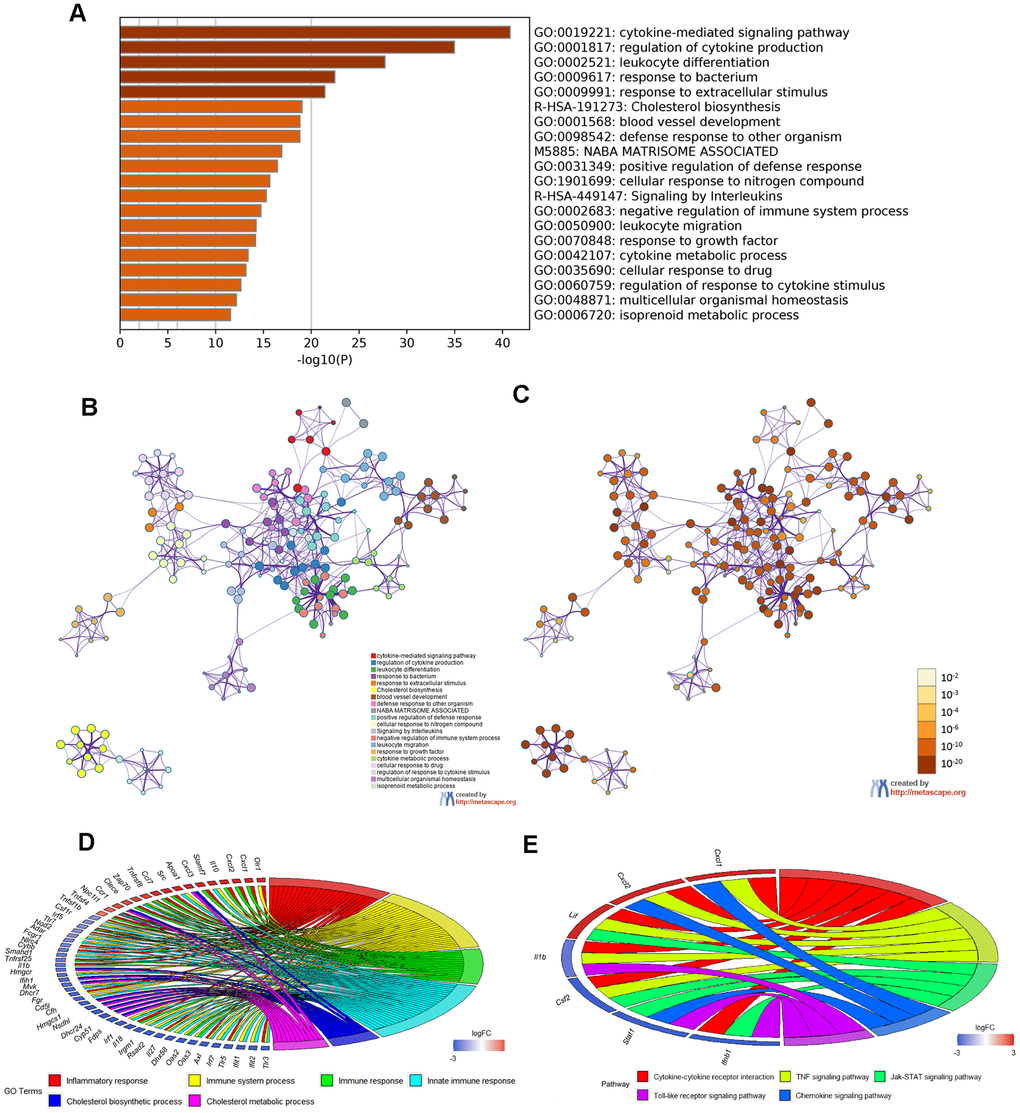
Figure 6.Enrichment analysis of Metascape and overlapped DEGs. (A) Bar graph of enriched terms, colored according to P value. Networks of enriched terms: (B) colored according to cluster ID and (C) colored according to P value. (D, E) Chord plot of the relationship between the overlapped DEGs and their corresponding GO and KEGG terms, together with the log2FC of the genes. Left half of Chord indicates whether the gene expression was up- or down-regulated. The right half represents different terms with different colors.