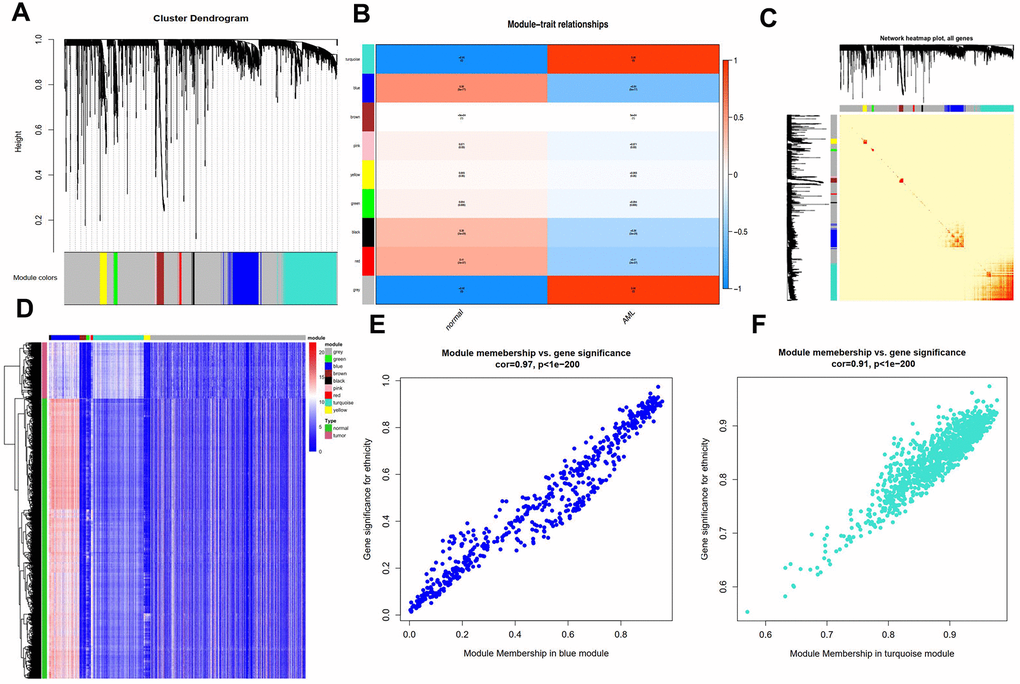
Figure 2.Characterization of adult AML co-expression network. (A) Cluster dendrogram and colored display of the network. (B) Relationship between modules and phenotypes. Turquoise and blue module are the top two modules related with AML phenotype according to P-value. (C) Network heatmap plot for genes in the modules in hierarchical clustering dendrograms. The deeper the red, the more correlated between the genes. (D) Gene expression differences between AML samples and normal control in modules. (E) Gene Significance (GS) and Module Membership (MM) analyses in turquoise and (F) blue module.