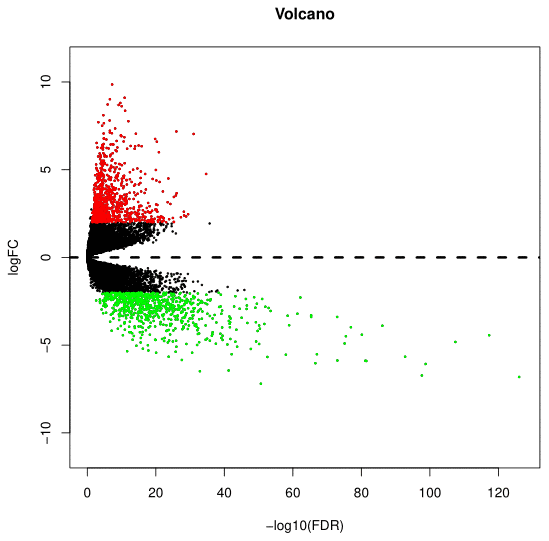
Figure 1.Identification of DEGs in PAAD based on the TCGA and GTEx datasets. Volcano plot of gene expression profile data between PAAD and normal samples. Red dots represent upregulated genes in PAAD; green dots represent down-regulated genes; black dots represent non-DEGs. |logFC|>1, FDR<0.05. DEGs, differentially expression genes; PAAD, pancreatic adenocarcinoma; TCGA, the Cancer Genome Atlas; GTEx, Genotype-Tissue Expression.