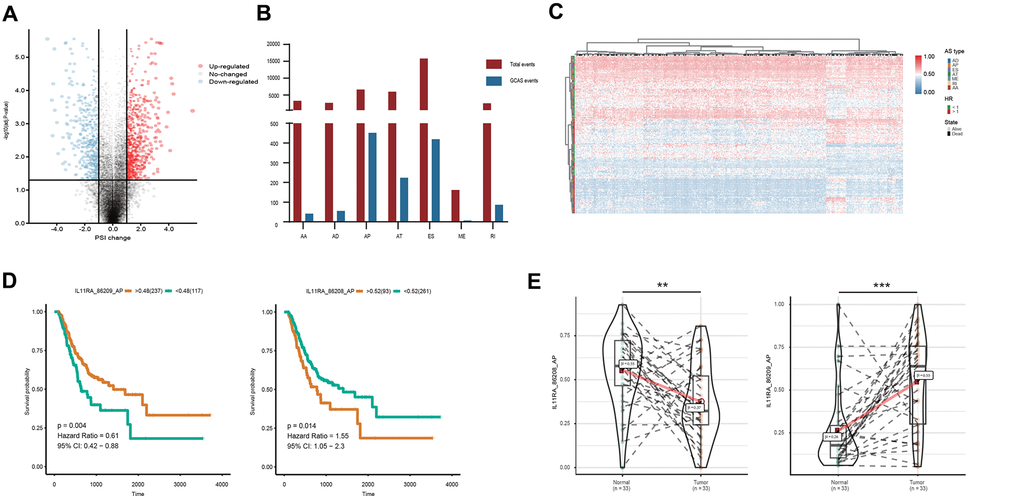
Figure 1.Profiling of AS events identified in the TCGA GC cohort. (A) GCAS events between GC and adjacent normal tissues were visualized in a volcano plot. (B) The number of GCAS events and total AS events were depicted according to the seven AS types. (C) Heat map for the PSI values of 173 OS-GCAS events identified in 354 GC patients. (D) Kaplan-Meier curves for the paired survival-related GCAS events (IL11RA_86208_AP and IL11RA_86209_AP). (E) Violin plots for the PSI values of the paired survival-related GCAS events (IL11RA_86208_AP and IL11RA_86209_AP) between GC and adjacent normal tissues.