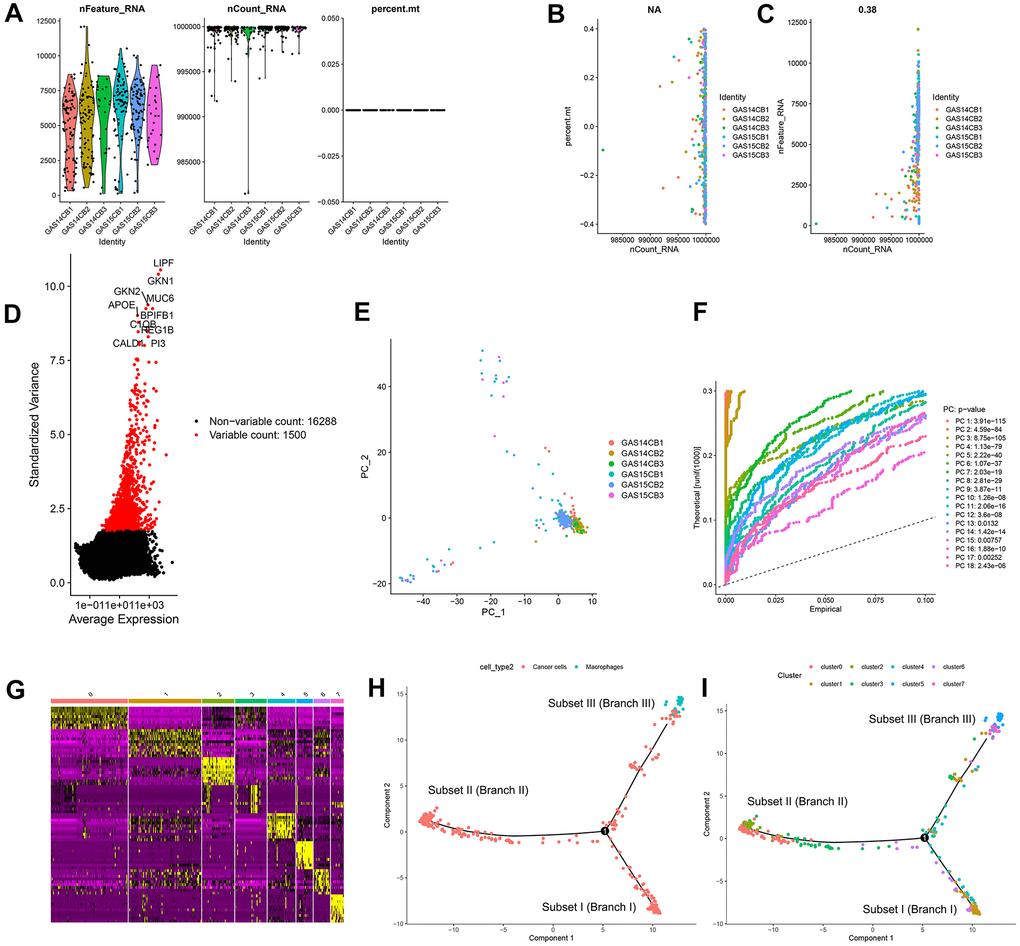
Figure 1.Quality control and normalization of scRNA-seq data, dimensionality reduction and cell trajectory analysis. (A) After quality control and normalization, 2 nonconforming cells were excluded, and 400 cells were screened for further analysis. (B) Correlation analysis between sequencing depth and mitochondrial gene sequences was detected. (C) Correlation analysis between sequencing depth and total intracellular sequences. (D) A total of 16,288 genes were analyzed, of which 14,788 had low intercellular variation and 1,500 had high variation. (E) PCA based on scRNA-seq data. (F) Eighteen PCs with significant differences were identified with P < 0.5. (G) Four hundred GC cells were aggregated into 8 clusters and the top 10% of marker genes in each cluster are displayed on the heat map. (H, I) Pseudotime and trajectory analysis. PCA: principal component analysis, PCs: principal components, GC: gastric cancer.