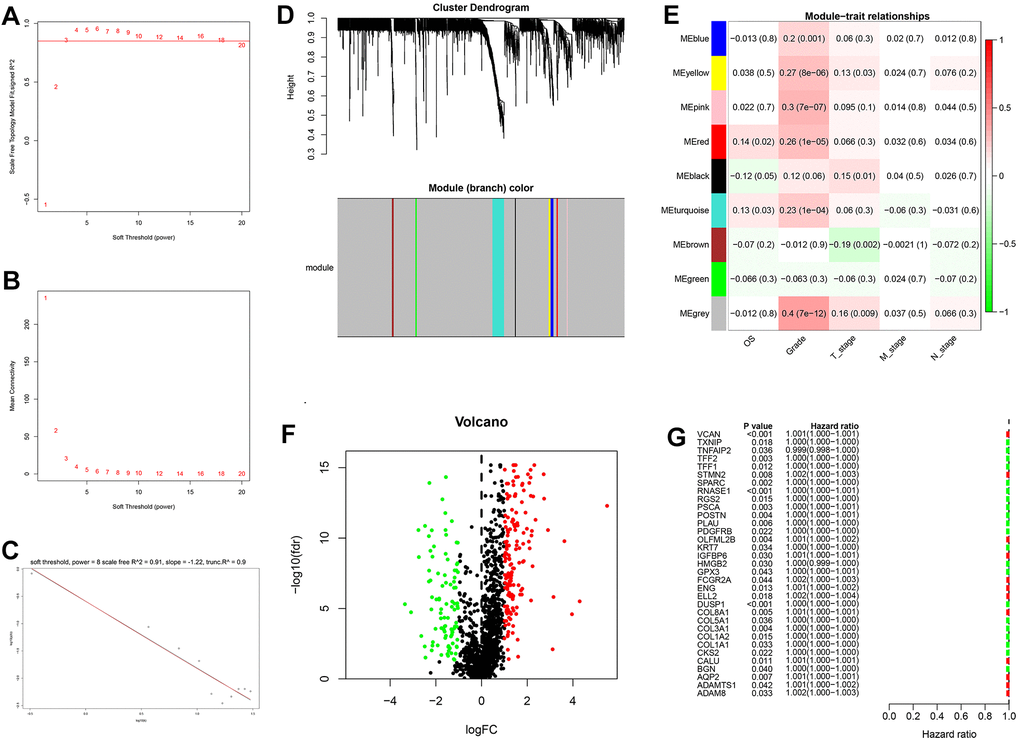
Figure 6.Weighted correlation network analysis, differential expression analysis and univariate analysis of GDRGs. (A–D) Based on weighted correlation network analysis, 9 modules were accessed with a soft threshold = 8. (E) Correlation analysis between modules and clinicopathological data. (F) Differential expression analysis identified 258 differentially expressed GDRGs in 6 modules, with |log2(FC)| > 1 and FDR < 0.05. (G) Univariate analysis of differentially expressed GDRGs. GC: gastric cancer, GDRGs: GC differentiation-related gene, FDR: false discovery rate.