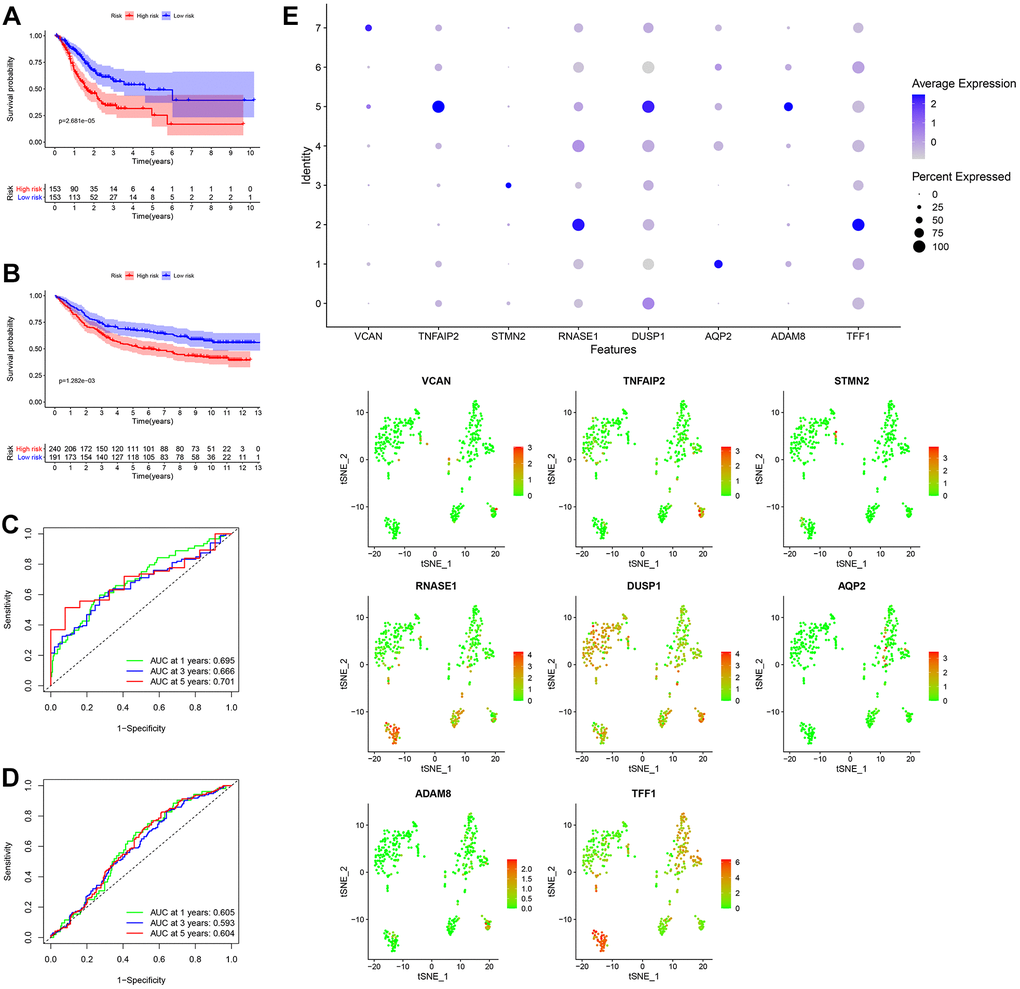
Figure 7.Generation, evaluation and validation of a prognostic risk scoring signature. (A) Kaplan-Meier analysis between the low-risk group and the high-risk group in the TCGA cohort. (B) Kaplan-Meier analysis between the low-risk group and the high-risk group in the GSE84437 dataset. (C) In the TCGA cohort, the areas under the ROC curves for predicting 1-year, 3-year and 5-year OS. (D) In the GSE84437 dataset, the areas under the ROC curves for predicting 1-year, 3-year and 5-year OS. (E) Expression levels of eight GDRGs in eight clusters. OS: overall survival, TCGA: The Cancer Genome Atlas, ROC: receiver operating characteristic, GDRGs: gastric cancer differentiation-related genes.