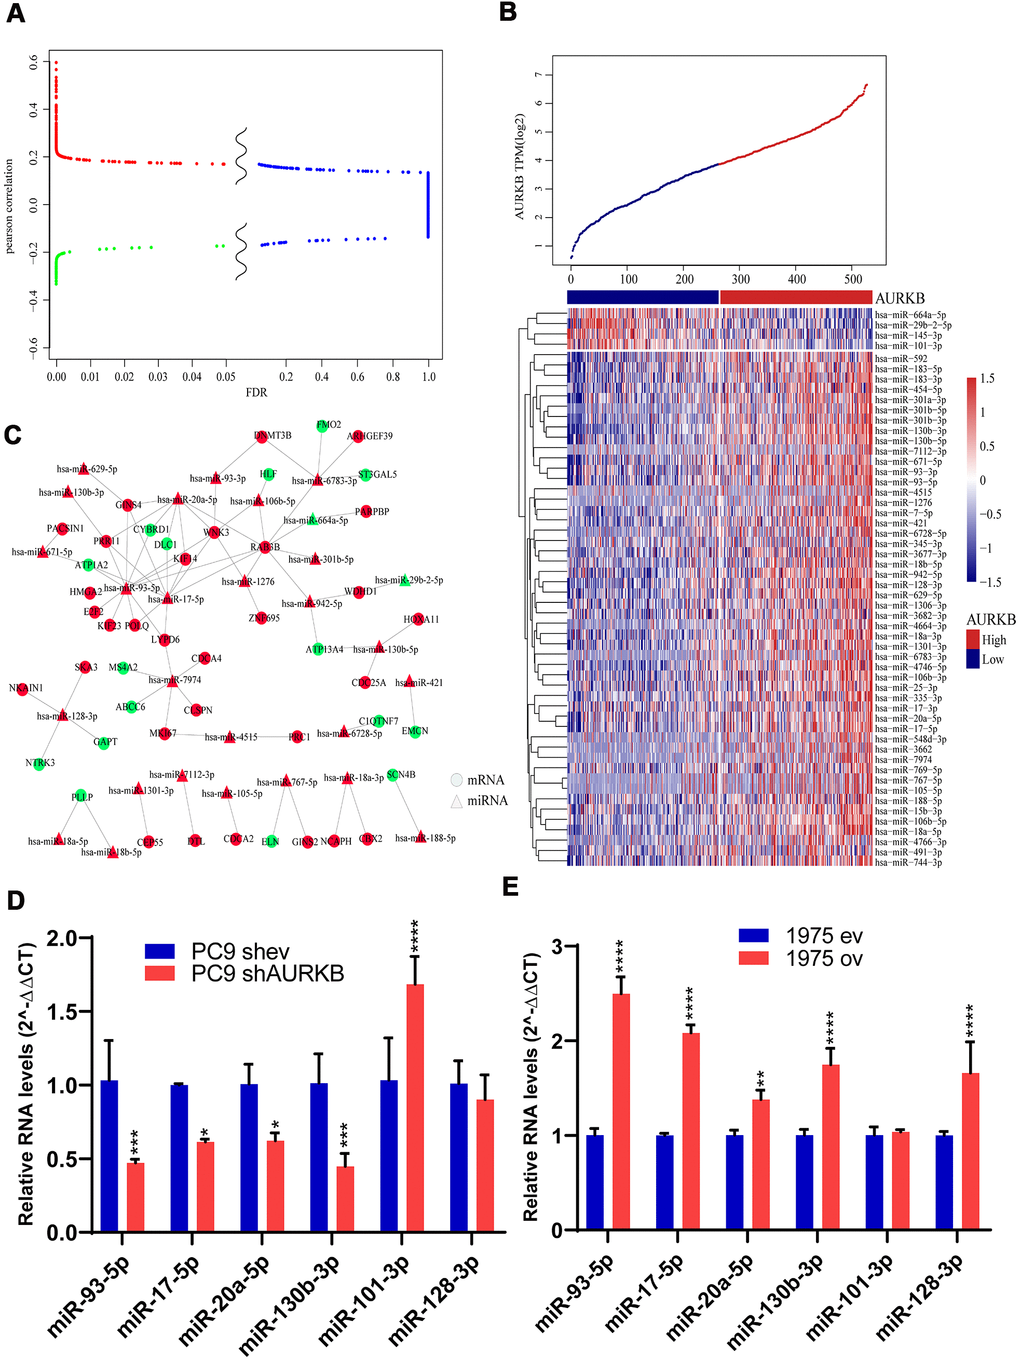
Figure 4.MiRNAs associated with AURKB. (A) Differential volcano map showed the distribution of microRNAs. Red color indicates microRNAs positively correlated with AURKB, green indicates negative ones (Pearson correlation, R>0.13 or < -0.13), and blue color indicates irrelevant microRNAs (FDR > 0.05). (B) Clusters of 54 identified miRNAs significantly associated with AURKB, and samples were arranged with increasing expression of AURKB from left to right. (C) Regulatory network analysis of significantly correlated mRNAs and microRNAs, red represents upregulation, and green represents downregulation. (D, E) Relative expression levels of miR-93-5p, miR-17-5p, miR-20a-5p, miR-130b-5p, miR-101-3p, and miR-128-3p in PC9 shev and PC9 shAURKB (AURKB knockdown) cells (D) and 1975 ev and 1975 ov (AURKB overexpression) cells (E) constructed using lentivirus, U6 served as a internal control (2-ΔΔCT method, p<0.05, *; p<0.01, **; p<0.001, ***; p<0.0001, ****).